Login to Ask a Question or Reply
Forum Replies Created by Vishwas R
-
Chart elements may look blur when either zoom within display setting of browser or windows is changed. Resetting zoom to 100% should work fine in this case. Also the look & feel of title, label and other text elements depends on font-family being used. You can try customizing the font-family of text by setting the fontFamily property.
If the issue still persists, kindly create JSFiddle reproducing the issue you are facing and share it with us so that we can look into your code, understand the scenario better and help you out.
—
Vishwas R
Team CanvasJSThe issue seems to be with x-value that you are passing, please refer this stackoverflow thread for more info. Can you try passing time-stamp instead of date and see if it works?
If the issue still persists. kindly share sample project along with sample data over Google-Drive or Onedrive so that we can run it locally at our end to debug and help you resolve the issue.
—
Vishwas R
Team CanvasJSYou can customize the color of dataPoint by setting color property. Please take a look at this JSFiddle for an example showing changing the color of line based on the dataPoint value.
—
Vishwas R
Team CanvasJSJune 17, 2019 at 6:36 pm in reply to: Problems with Chart Toolbar when zoom enabled and viewportMaximum set #25542Christian,
You can check if the triggered event is zoom/pan or reset by checking e.trigger within rangeChanged handler. Please take a look at this JSFiddle.
—
Vishwas R
Team CanvasJSThanks for your suggestion, we will reconsider this behavior for future releases.
—
Vishwas R
Team CanvasJSYou can show last few set of dataPoints with the help of shift method. Please take a look at this documentation page for step to step tutorial on creating Dynamic Charts.
I would suggest you to store CSV in
date-time,valueformat. Please take a look at this updated JSFiddle for an example withJun 10 2019 00:00:03 EST,422format.—
Vishwas R
Team CanvasJSJune 12, 2019 at 6:22 pm in reply to: firefox report canvasjs slow down browser when render live data chart #25500In v2.3GA, we have improved resource handling in case of dynamic / live charts which reduces memory consumption. However we are not sure about your use-case and unable to reproduce the issue you are mentioning with v2.2 aswell. If you could share us the use-case over JSFiddle or in a static HTML file, we can investigate further, brief more about the exact issue (and fix if any).
—
Vishwas R
Team CanvasJSJune 11, 2019 at 10:46 am in reply to: firefox report canvasjs slow down browser when render live data chart #25483We are unable to reproduce the issue at our end. I request you to share a sample reproducing the issue – along with sample data so that we can look into the code, understand the scenario better and help you resolve the same.
I would also recommend you to use the latest version of CanvasJS and try the same.
—
Vishwas R
Team CanvasJSJune 10, 2019 at 10:25 am in reply to: firefox report canvasjs slow down browser when render live data chart #25456Adam,
CanvasJS is a JavaScript Charting library that can be integrated with any technologies like Angular, React, VueJS, etc. Please refer this tutorial for deployment of website in Azure.
—
Vishwas R
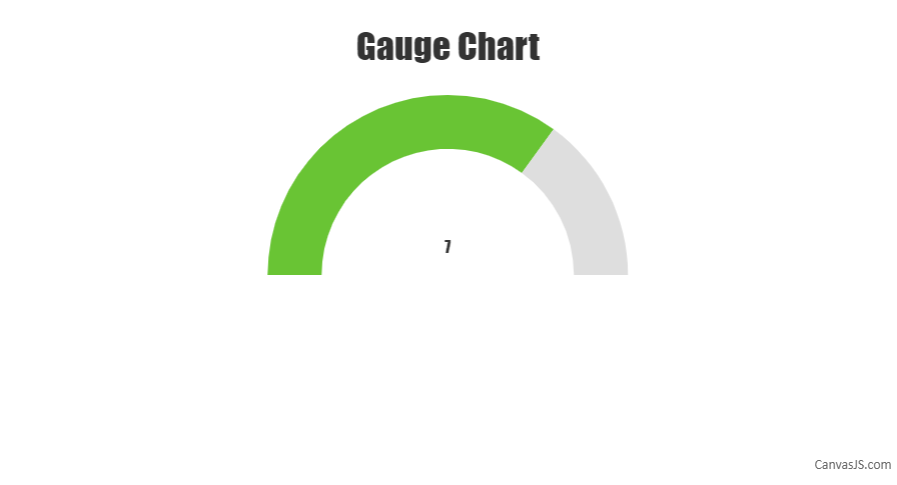
Team CanvasJSSorry, we don’t have a gauge chart as of now but a semi doughnut chart can be used to create it. Please below the steps below for creating a gauge chart using a doughnut chart.
First, we need to create an object that will store all the necessary data that is needed to be shown on the gauge chart. The code snippet below shows an example of that object:
var gauge = {
  title:{text: "Gauge Chart"},
  data: { y: 7 }, //gauge value
  maximum: 10
};
In the second step, we will initialize the chart object and populate its dataPoints considering the fact that only half of the doughnut chart be displayed. Please refer to the code snippet below for achieving the same:
var chart = new CanvasJS.Chart("chartContainer");
createGauge(chart);

//Function for gauge
function createGauge(chart){
  //Caluculation of remaining parameters to render gauge with the help of doughnut
  gauge.unoccupied = {
    y: gauge.maximum - gauge.data.y ,
    color: "#DEDEDE",
    toolTipContent: null,
    highlightEnabled: false,
    click : function (){ gauge.unoccupied.exploded = true; }
  }
  gauge.data.click = function (){ gauge.data.exploded = true; };
  if(!gauge.data.color)
    gauge.data.color = "#69C434";
  gauge.valueText = {text: gauge.data.y.toString(), verticalAlign :"center"};

  var data = {
    type: "doughnut",
    dataPoints: [
      {
        y: gauge.maximum ,
        color: "transparent",
        toolTipContent: null
      },
      gauge.data,
      gauge.unoccupied
    ],
  };

  if(!chart.options.data)
    chart.options.data = [];
  chart.options.data.push(data);

  if(gauge.title){
    chart.options.title = gauge.title;
  }

  //For showing value
  if(!chart.options.subtitles)
    chart.options.subtitles = [];
  chart.options.subtitles.push(gauge.valueText);

  chart.render();
}
You can also refer to take a look at this JSFiddle for a working example with sample code.
—
Vishwas R
Team CanvasJSThe dataPoints seems to be random as they are generated using random method and are not from CSV. Please take a look at this JSFiddle for Dynamic chart from CSV.
—
Vishwas R
Team CanvasJSIn jQuery plugin, you can get reference to the chart object using $(“#chartContainer”).CanvasJSChart(). And you can update any of the options – like
$("#chartContainer").CanvasJSChart().options.data[0].type = "column".However if you like to update chart-options and call chart.render(), as a first step you need to get chart reference as
$("#chartContainer").CanvasJSChart(). Once you have reference to the chart, you can update the chart-options and call chart.render(). Please refer second example in jQuery integration page for a live example.—
Vishwas R
Team CanvasJSKhanh,
You can explode (slideout / slidein) a slice of pie / doughnut chart programmatically using exploded property. Please refer documentation for more info on the same along with live example.
—
Vishwas R
Team CanvasJS