Login to Ask a Question or Reply
Forum Replies Created by Vishwas R
-
Michael,
A logarithmic axis can only plot positive values. There simply is no way to put negative values or zero on a logarithmic axis.
Fundamental: If 10L = Z, then L is the logarithm (base 10) of Z. If L is a negative value, then Z is a positive fraction less than 1.0. If L is zero, then Z equals 1.0. If L is greater than 0, then Z is greater than 1.0. Note that there no value of L will result in a value of Z that is zero or negative. Logarithms are simply not defined for zero or negative numbers.
Considering this as duplicate of Zero values in logarithmic mode draw off chart top?. Hence closing the same.
—
Vishwas R
Team CanvasJSMichael,
A logarithmic axis can only plot positive values. There simply is no way to put negative values or zero on a logarithmic axis.
Fundamental: If 10L = Z, then L is the logarithm (base 10) of Z. If L is a negative value, then Z is a positive fraction less than 1.0. If L is zero, then Z equals 1.0. If L is greater than 0, then Z is greater than 1.0. Note that there no value of L will result in a value of Z that is zero or negative. Logarithms are simply not defined for zero or negative numbers.
—
Vishwas R
Team CanvasJSSorry, as we are busy implementing some other important features at this point of time, we don’t have combination of bar with candlestick or line in our current roadmap. Hence there is no definite timeline for the same.
—
Vishwas R
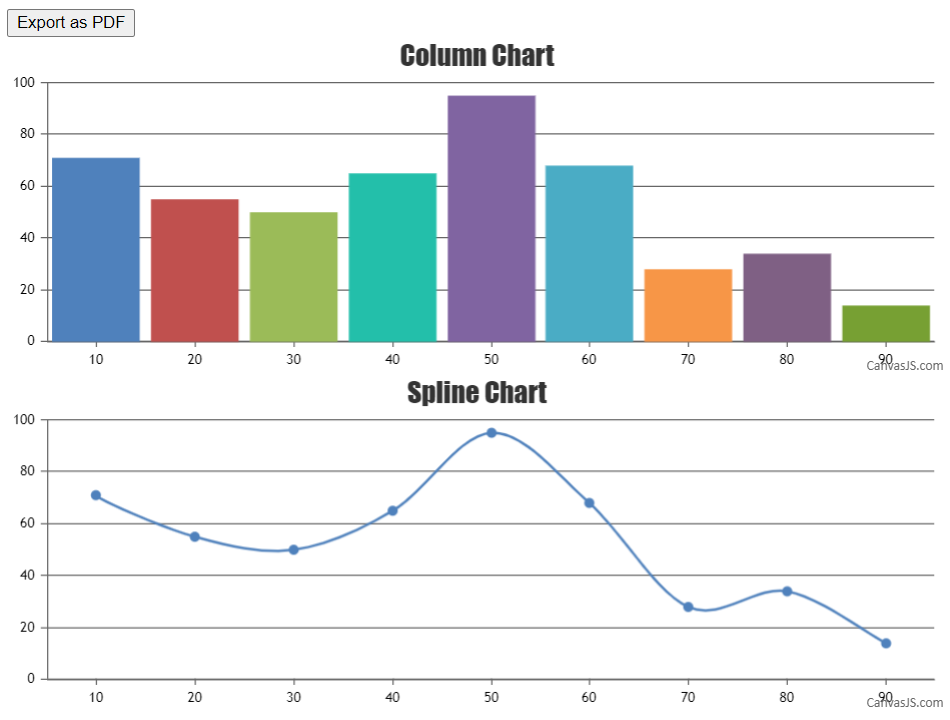
Team CanvasJSExporting chart as image is supported by CanvasJS. But, exporting multiple charts in a page is not supported as of now. You can export multiple charts in a page or the page itself with the help of 3rd party libraries html2canvas and jsPDF. Please refer respective library documentation for browser supports and polyfills.
—
Vishwas R
Team CanvasJSCanvasJS is a JavaScript based charting library which accept date-time in JavaScript date formats only. In your case, you will have to convert PHP date to JavaScript date to make it work fine. To achieve that, first you need to convert PHP date to PHP timestamp using strtotime. As PHP timestamp is in seconds and JavaScript timestamp is in milliseconds, you will have to multiply PHP timestamp by 1000. After converting it to JavaScript timestamp, you can pass it to chart data along with setting xValueType to ‘dateTime’. Please find the code-snippet below for converting PHP date to JavaScript timestamp.
$phpTimestamp = strtotime("2020-03-05");
$javaScriptTimestamp = $phpTimestamp * 1000;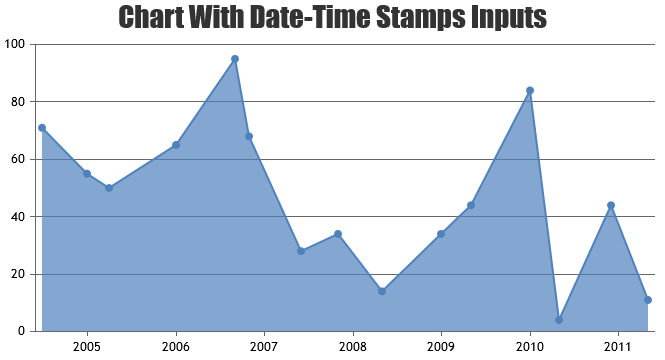
__
Vishwas R
Team CanvasJSBy default Chart takes the size of its container, if set. IF the size of the container is not set, chart takes default height and width because of which it overflows the parent’s height. In case of React wrapper, you can set the height and width of the chart-container by passing it as containerProps. Please take a look at this demo for an example on setting width, height and border for chart-container.
If you are still facing the issue, kindly create a sample project reproducing the issue and share it with us over Google-Drive or Onedrive. Alternately you can create sample project in CodeSandbox and share it with us so that we can understand the scenario better and help you resolve.
—
Vishwas R
Team CanvasJSMarch 5, 2020 at 6:25 pm in reply to: Multiple chart Export to PDF Button not responding for me #28568It seems to be working fine with a dependency on jQuery, html2canvas & jspdf libraries
Can you kindly create a sample project reproducing the issue you are facing and share it with us over Google-Drive or Onedrive so that we can look into the code, understand the scenario better and help you out?—
Vishwas R
Team CanvasJSCan you kindly give permission for the shared file so that we can download it, run it locally to understand the scenario better and help you out?
—
Vishwas R
Team CanvasJSIt seems to be working fine with a dependency on jQuery, html2canvas & jspdf libraries. Can you kindly create a sample project reproducing the issue you are facing and share it with us over Google-Drive or Onedrive so that we can look into the code, understand the scenario better and help you out?
Considering this as duplicate of Multiple chart Export to PDF Button not responding for me. Hence closing the same.
—
Vishwas R
Team CanvasJSCombining bar chart with candlestick or line chart is not possible as of now.
—
Vishwas R
Team CanvasJSNumber of labels over an axis depends on multiple factors like the width/height of the chart, minimum, maximum & interval of the axis. You can use interval property to show labels at every interval set.
If you are still facing any issue, kindly create a JSFiddle with your use-case & data and share it with us so that we can look into the code to understand the scenario better and help you resolve.
—
Vishwas R
Team CanvasJSArmin,
Email Based Support is available in Priority Support licenses with a turnaround time of 24 hours. Please contact sales[at]canvasjs[dot]com for any sales related queries.
For forums based support, you can upload sample project to Google-Drive or Onedrive and share it with us so that we can look into code, understand the scenario better and help you resolve the issue you are facing.
—
Vishwas R
Team CanvasJSYou can use HTML Unicode characters to add desired symbols in indexLabel as shown in this gallery example.
—
Vishwas R
Team CanvasJS