Home Forums Chart Support Method call for Zoom / pan Function in Canvas Js

Method call for Zoom / pan Function in Canvas Js

Viewing 8 posts - 1 through 8 (of 8 total)
  • #26664

    Hope you will find this link useful : https://jsfiddle.net/santy_naren/xhrng6w9/2/

    #26683

    @santhoshnarendra,

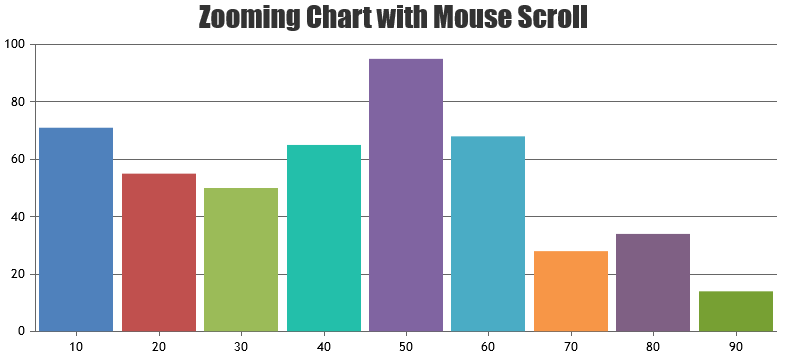
    Are you looking for programatically zooming / panning the chart? If so you can achieve it by changing viewportMinimum and viewportMaximum. Please take a look at this JSFiddle for the same.
    Zooming Chart using Mouse Wheel


    Vishwas R
    Team CanvasJS

    #26685

    Dear Vishwa Thanks .. similarly I want the Pan Zoom Option to Come as we scroll

    #26687

    @santhoshnarendra,

    Setting zoomEnabled property to true will show zoom / pan & reset buttons, once the chart is zoomed.
    zoomEnabled: true,
    Please take a look at this updated JSFiddle.


    Vishwas R
    Team CanvasJS

    #26688

    Vishwa Thanks for your support but I need the Pan Function to be called as soon as we zoom . In the above given example only after selecting a region we can chose Pan Function . If you cant understand do Call me at +91 80561 60364

    #26734

    @santhoshnarendra,

    You can perform button click programmatically to switch to pan mode by default & hide the zoom/pan button using CSS to do so. Below is the code-snippet for the same.

    -----CSS----
    .canvasjs-chart-toolbar> button:first-child {
      display: none !important;
    }
    ----JS----
    var parentElement = document.getElementsByClassName("canvasjs-chart-toolbar");
    var childElement = document.getElementsByTagName("button");
    if(childElement[0].getAttribute("state") === "pan"){
      childElement[0].click();
    }

    Please take a look at this JSFiddle for complete code.


    Vishwas R
    Team CanvasJS

    #28130

    How to make pan function to work across x and y axis irrespective of the viewport maximum or minimum like google maps to scroll

    #28183

    @santhoshnarendra,

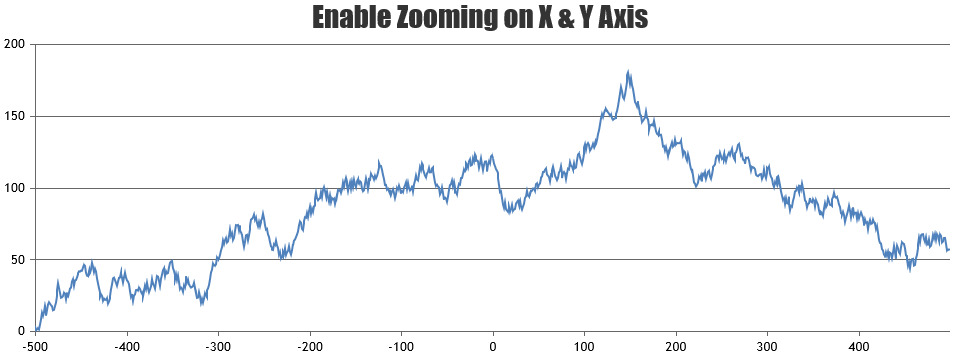
    zoomType property allows you to control the axis for which zooming and panning are enabled. Setting zoomType to ‘xy’ will let you zoom / pan across both x and y axes. Please refer documentation for more info.
    Zooming Chart verically & horizontally


    Vishwas R
    Team CanvasJS

Viewing 8 posts - 1 through 8 (of 8 total)

You must be logged in to reply to this topic.