Login to Ask a Question or Reply
Forum Replies Created by Vishwas R
-
Robert Masse,
It seems to be working fine – the event seems to be firing even when you click on marker. Please refer he screenshot below.

—
Vishwas R
Team CanvasJSRobert Masse,
Click event is fired even on clicking the marker. Please take a look at this JSFiddle.
If you are still facing issue, kindly create JSFiddle reproducing the issue you are facing and share it with us so that we can look into the code, understand the scenario better and help you resolve.
—
Vishwas R
Team CanvasJSIs Canvasjs Better then PHP
CanvasJS is a JavaScript based charting library which you can integrate with your PHP application. Please take a look at PHP Gallery for examples on integrating CanvasJS in PHP.
Hello All, I want to know which one is better for web development. I have a search on google to find comparison between JS and PHP. Can anyone suggest to me which one better in terms of simplicity and security between JS and PHP?
JavaScript is a client-side scripting language, which means the source code is processed by the client’s web browser rather than on the web server whereas PHP is a server side scripting language that can embedded in HTML. Please refer this article for more information on the same.
—
Vishwas R
Team CanvasJSChris,
In JavaScript month index starts from 0(January) and ends at 11(December). For more information please refer to this StackOverflow page.
A second point, I seem to have to include the following code just to get the chart to work in the first place (before I try adding striplines):
for (var i = 0; i < rawData.length; i++) { rawData[i][“x”] = new Date(rawData[i][“x”]); }X values can either be number or date-object. In your case, to make it date-object this loop would be required.
—
Vishwas R
Team CanvasJSCan you kindly create JSFiddle reproducing the issue you are facing and share it with us so that we can look into your code, understand the scenario better and help you out?
—
Vishwas R
Team CanvasJSSorry, it’s not possible to add space between columns of multi-series charts as of now.
—
Vishwas R
Team CanvasJSShowing ‘>’ within label seems to be working fine. Can you kindly create JSFiddle reproducing the issue you are facing and share it with us so that we can look into the code, understand the scenario better and help you resolve?
From what we have observed, sometimes things get delayed mostly when we are not able to reproduce the issue or not able to understand the exact requirements or the solution that we provide may not work properly due to the variation in chart-options being used by you and us.
Having a JSFiddle helps us in figuring out the issue and many a time we can just edit your code on JSFiddle to fix the issue right away.
—
Vishwas R
Team CanvasJSOne of the representatives from sales team will get in touch with you soon. For further license related queries please contact sales[at]canvasjs[dot]com.
—
Vishwas R
Team CanvasJSMay 28, 2020 at 6:54 pm in reply to: data points of chart to table so that table and chart point look aligned to each #29384In the above snippet, we couldn’t find chart options / code related to CanvasJS. Can you kindly create JSFiddle with CanvasJS Chart options that you are using and share it with us so that we can look into code, understand the scenario better and help you resolve?
If you are looking for adding HTML table below chart showing dataPoints, please take a look at this JSFiddle.
—
Vishwas R
Team CanvasJS@ksridharembridgesolutions-in,
Based on the error you are getting (404 Error) it seems like dependencies are missing. Kindly check for the same.
If you are still facing issue, kindly share the sample project reproducing the issue and share it with us over Google-Drive or Onedrive so that we can run it locally, understand the scenario better and help you out.
—
Vishwas R
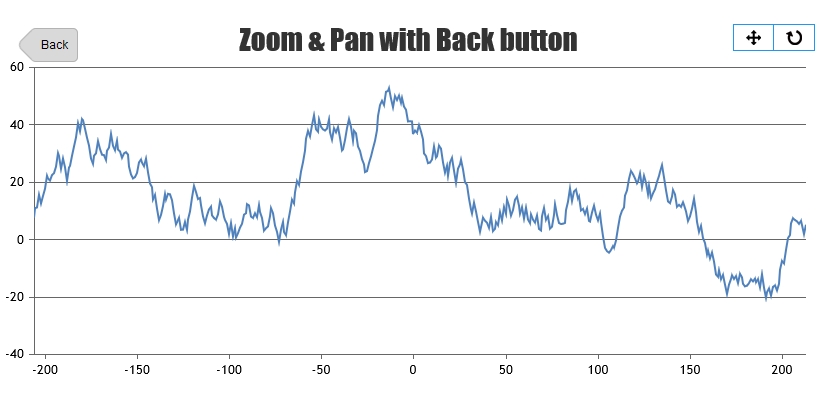
Team CanvasJSAs address by Bivek in previous reply, zoomout in steps is not available as an inbuild feature as of now. However you can achieve the same with the help of rangeChanging event. Please take a look at this JSFiddle for an example.
—
Vishwas R
Team CanvasJSPlease take a look at this StackBlitz for an example on positioning image over chart in React.
—
Vishwas R
Team CanvasJSPlease take a look at this Sample Project on rendering chart in React Native app with the help of WebView.
—
Vishwas R
Team CanvasJS