Login to Ask a Question or Reply
Forum Replies Created by Vishwas R
-
Creating chart once & updating the stripLine value based on slider movement using set method should work fine in your case. Please take a look at this updated JSFiddle.
Note: We recommend you to create chart-instance once & reuse it rather than creating new chart-instance upon movement of slider.
—
Vishwas R
Team CanvasJSThere was an issue in setting minimum & maximum of slider programmatically using set method after changing the range manually. We have just released StockChart v1.0.7 with this bug fix. Please refer to the release blog for more information. Do download the latest version from download page & let us know your feedback.
If you are still facing issue, kindly create JSFiddle reproducing the issue you are facing with sample / dummy data and share it with us so that we can look into your code / StockChart options being used, understand the scenario better and help you out.
—
Vishwas R
Team CanvasJSSeptember 21, 2020 at 10:39 am in reply to: Setting navigator slider minimum isn’t working after panning #31319[UPDATE]
We have just released StockChart v1.0.7 with this bug fix. Please refer to the release blog for more information. Do download the latest version from download page & let us know your feedback.
—
Vishwas R
Team CanvasJS[UPDATE]
We have just released StockChart v1.0.7 with this bug fix. Please refer to the release blog for more information. Do download the latest version from download page & let us know your feedback.
—
Vishwas R
Team CanvasJSSeptember 17, 2020 at 7:08 pm in reply to: arranging legends in stock chart when multiple chart are there #31286You can change the position of legends within individual chart by setting verticalAlign & horizontalAlign. Please refer our documentation for more customization options available.
If you are still facing issue kindly create JSFiddle with your use-case and share it with us so that we can look into the code / chart-options being used, understand the scenario better and help you out.
—
Vishwas R
Team CanvasJSShashank,
Thanks for the reporting the use case, we are aware of this issue and we will be fixing it in our upcoming versions.
—
Vishwas R
Team CanvasJSSeptember 17, 2020 at 7:08 pm in reply to: How to implement trackball behavior in canvas line chart #31284Rami Mitri,
You can achieve this with the help of updated & hidden events of crosshair as shown in this updated JSFiddle.
—
Vishwas R
Team CanvasJSSeptember 16, 2020 at 7:47 pm in reply to: How to implement trackball behavior in canvas line chart #31238Rami Mitri,
You can achieve this by using updated event of toolTip as shown in this JSFiddle.
—
Vishwas R
Team CanvasJSStriplines over axisX supports both numeric & date-time object. You can set stripLines value to a number or date-time to add stripLines. If you are still facing issue, kindly create JSFiddle reproducing the issue you ate facing and share it with us so that we can look into the code / chart-options being used, understand the scenario better and help you resolve.
—
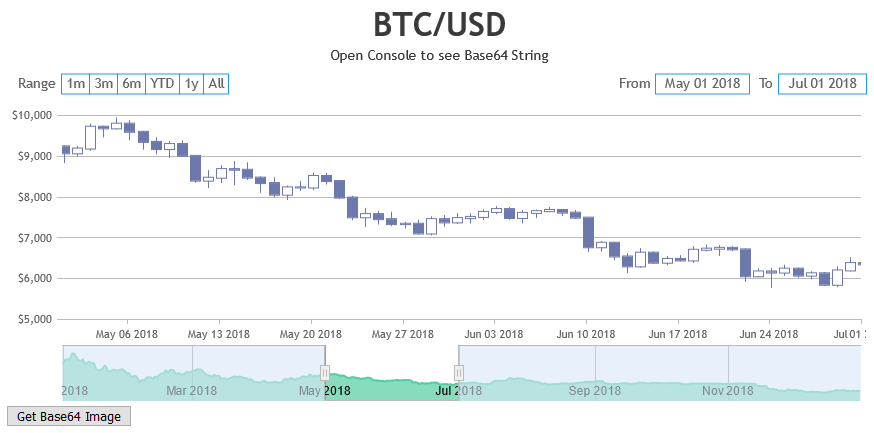
Vishwas RSeptember 9, 2020 at 6:48 pm in reply to: Export Chart as Image/Get chart data as Base64 format #30981Exporting entire StockChart as base64 is not available as an inbuilt feature as of now. However you can do so by using html2canvas. Below is the code-snippet for the same.
html2canvas(document.querySelector("#chartContainer")).then(canvas => {
	var dataURL = canvas.toDataURL();
	console.log(dataURL)
});
Please take a look at this JSFiddle for complete code.
—
Vishwas R
Team CanvasJSYou can get the reference to the chart instance by passing onRef = {ref => this.chart = ref} props to the component, which you can use to export chart on clicking button. Please refer React Integration documentation for more information. Also take a look at this StackBlitz for an example.
—
Vishwas R
Team CanvasJSYou can format axis labels as per your requirements by setting valueFormatString.
—
Vishwas R
Team CanvasJSCan you kindly share pictorial representation or an example of your requirements so that we can understand it better and help you fulfill it?
—
Vishwas R
Team CanvasJS[UPDATE]
@johnosman,We have just released StockChart v1.0.5 Beta-1 with this feature. Please check release blog for more information. Do download the latest version from our download page & let us know your feedback.
—
Vishwas R
Team CanvasJSAugust 24, 2020 at 6:46 pm in reply to: Is it possible to add html on the label of the column chart #30800You can achieve this with the help of striplines & it’s labels as shown in this JSFiddle.
—
Vishwas R
Team CanvasJS