Login to Ask a Question or Reply
Forum Replies Created by Vishwas R
-
Richo,
Can you kindly create sample project reproducing the issue and share it with us over Google-Drive or Onedrive along with sample data so that we can run it locally to understand the scenario better and help you out?
—
Vishwas R
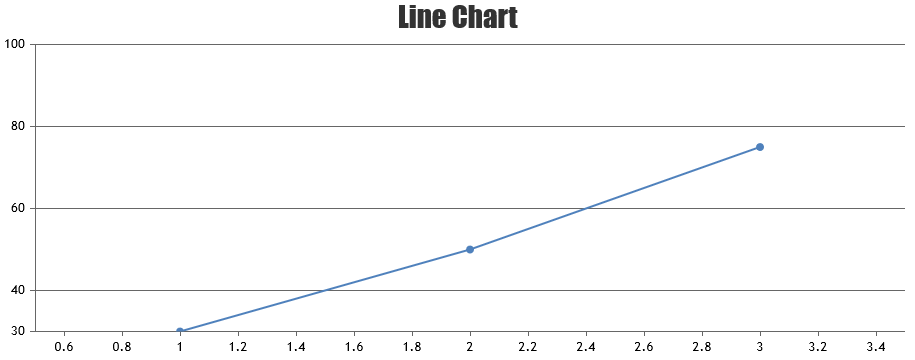
Team CanvasJSApril 20, 2021 at 6:33 pm in reply to: Displaying multiline chart with label with some data points have no data #34028Chart doesn’t automatically group dataPoints by its label. When only label is given (without x-value), internally it assigns x values to dataPoints in an order. So, there can be different dataPoints with same x value but different label. You can pass x-value along with label to group them accordingly. Please find the updated datapoints below.
data: [
    {
      type: "line",
      dataPoints: [
        { x: 1, y: 30, label: "label1" },
        { x: 3, y: 40, label: "label3" },
        { x: 4, y: 50, label: "label4" },
        { x: 5, y: 60, label: "label5" },
        { x: 7, y: 90, label: "label7" },
        { x: 8, y: 20, label: "label8" },
        { x: 9, y: 50, label: "label9"}

      ]
    }, {
      type: "line",
      dataPoints: [
        { x: 1, y: 10, label: "label1" },
        { x: 2, y: 20, label: "label2"},
        { x: 3, y: 30, label: "label3" },
        { x: 4, y: 40, label: "label4" },
        { x: 5, y: 50, label: "label5" },
        { x: 6, y: 60, label: "label6" },
        { x: 7, y: 70, label: "label7" },
        { x: 8, y: 80, label: "label8" },
        { x: 9, y: 90, label: "label9"}

      ]
    }
  ]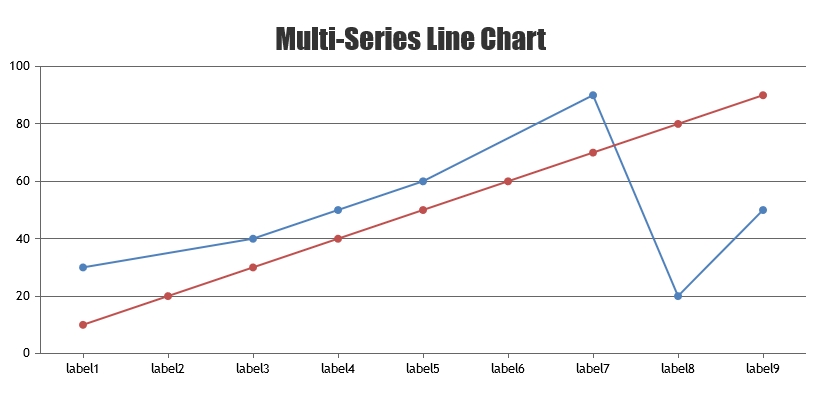
Please take a look at this JSFiddle for complete code.
You can use unicode for superscript / subscript in chart elements like title, legend, indexLabel, etc. Please take a look at this JSFiddle for an example on same.
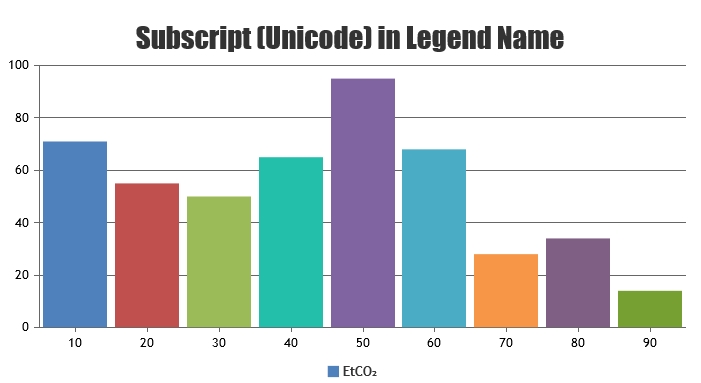
Also refer to this forum topic for relevant query / solutions.
—
Vishwas R
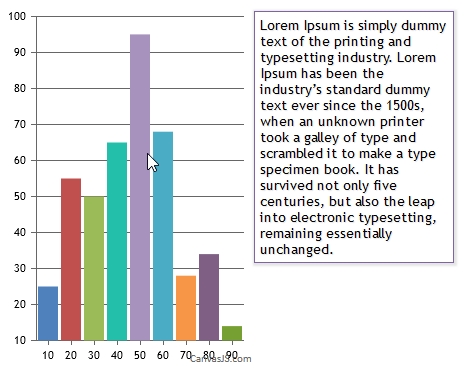
Team CanvasJSYou can customize the max-width of tooltip & it’s content by setting following CSS style properties for tooltip & it’s children.
.wordwrap {
   white-space: pre-wrap;
}
.canvasjs-chart-tooltip * {
  max-width: 200px !important;
}
.canvasjs-chart-tooltip {
  left: 250px !important;
  width: 200px;
}
Please take at this JSFiddle for complete code.
—
Vishwas R
Team CanvasJSApril 19, 2021 at 6:40 pm in reply to: Controls the number of tooltips according to the number of availble – legends #34014You can hide the information related to hidden dataseries by setting toolTipContent of that particular dataseries to null. Please find the code-snippet below.
itemclick : function(e) {
  var content;
  if (typeof(e.dataSeries.visible) === "undefined" || e.dataSeries.visible) {
    e.dataSeries.visible = false;
    content = e.chart.data[e.dataSeriesIndex].toolTipContent;
    e.dataSeries.toolTipContent = null;
  }
  else {
    e.dataSeries.visible = true;
    e.dataSeries.toolTipContent = content;
  }
  chart.render();
}
Please take a look at this JSFiddle for complete code.
—
Vishwas R
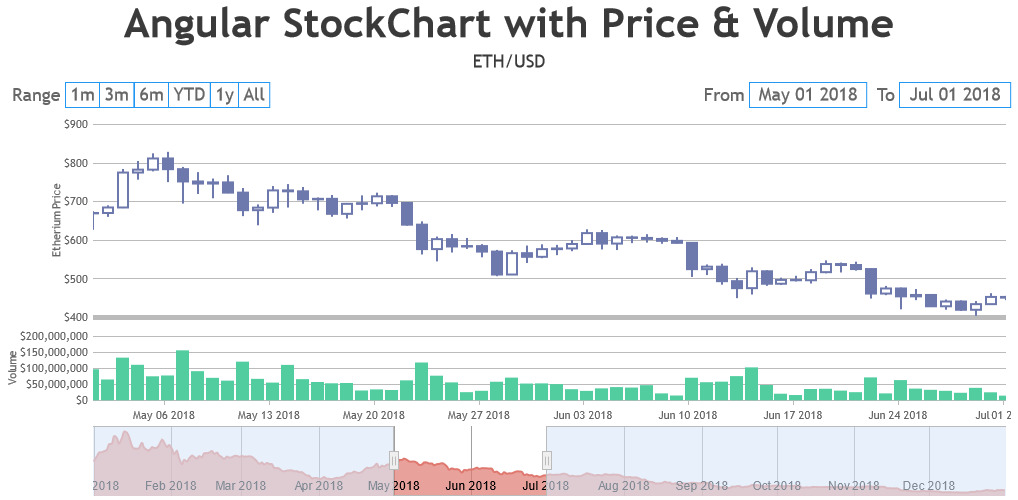
Team CanvasJSApril 8, 2021 at 6:17 pm in reply to: _assets_canvasjs_min__WEBPACK_IMPORTED_MODULE_1__.StockChart is not a constructo #33899You can create Chart & StockChart by importing canvasjs.stock.min.js but you can create only chart using canvasjs.min.js. Based on the code that you have shared, you are trying to create StockChart using canvasjs.min.js. Instead, importing canvasjs.stock.min.js to your project should work fine in this case. Please download the StockChart from download page.
If you are still facing issue, kindly create sample project and share it with us over Google-Drive or Onedrive so that we can run it locally at our end to understand the scenario better and help you out.
—
Vishwas R
Team CanvasJSYou can have a condition check before pushing image in addMarkerImages1 method to avoid adding image when datapoint y-value is empty string. Please find the code-snippet below.
function addMarkerImages1(chart1) {
  for (var i = 0; i < chart1.data[1].dataPoints.length; i++) {
	if(chart1.data[1].dataPoints[i].y != ""){
		Markers.push({image: $("<img>").attr("src",chart1.data[1].dataPoints[i].ImageUrl)
		  .css("display", "none")
		  .css("height", 20)
		  .css("width", 20)
		  .appendTo($("#chartContainer1>.canvasjs-chart-container"))
		, dataPointIndex: i});
	}
  }
  for(var i = 0; i < Markers.length; i++)
	positionMarkerImage1(Markers[i].image, Markers[i].dataPointIndex);
}
Please take a look at this JSFiddle for complete code.
If you are still facing issue, kindly create JSFiddle reproducing the issue you are facing & share it with us so that we can run the code at our end, debug to understand the scenario & help you resolve.
—
Vishwas R
Team CanvasJSYou can set custom range to axis by setting minimum & maximum. Based on the image that you have shared, you can use reversed axis to show negative values towards top & positive towards bottom. Below is the code-snippet to set y-axis range from -10 to 120.
axisY: {
    reversed: true,
    minimum: -10,
    maximum: 120
}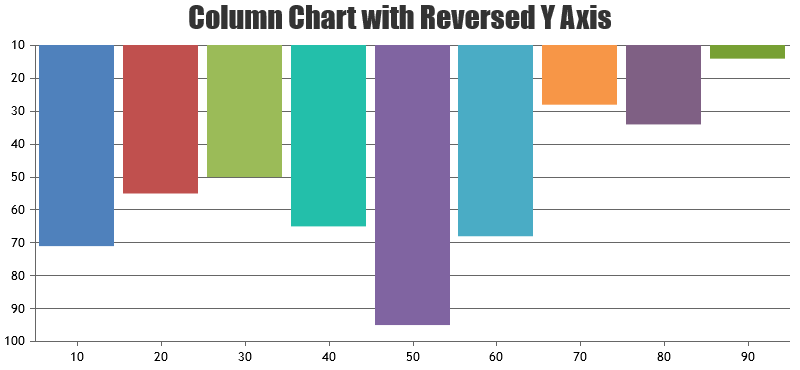
—
Vishwas R
Team CanvasJSIn the link that you have shared, there are couple of issues because of which image is not being shown. Please find them addressed below.
1. Image for the 1st datapoint is not shown as markerImageUrl is not passed to it. Passing markerImageUrl works fine.
{"y":"","label":125, "markerImageUrl":"https:\/\/soundoflife.in\/audiology\/images\/less-than.png"}2. Images are not being shown in 2nd chart as imageUrl property is being stored in 2nd dataseries of the chart but while passing it as src, you are trying to read it from 1st dataseries. Reading it from 2nd dataseries works fine in this case. Please find the code-snippet below.
function addMarkerImages1(chart1) {
  for (var i = 0; i < chart1.data[1].dataPoints.length; i++) {
    Markers.push($("<img>").attr("src",chart1.data[1].dataPoints[i].ImageUrl)
      .css("display", "none")
      .css("height", 20)
      .css("width", 20)

      .appendTo($("#chartContainer1>.canvasjs-chart-container"))
    );
    positionMarkerImage1(Markers[i], i);
  }
}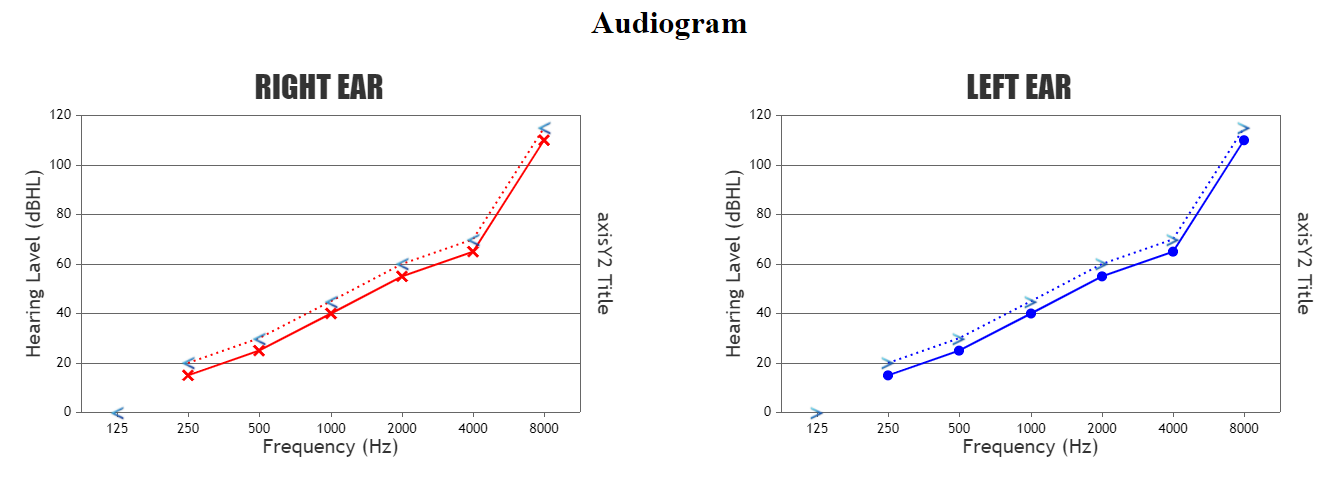
If you are still facing issue, kindly create JSFiddle reproducing the issue you are facing and share it with us so that we can look into the code, understand the scenario better and help you out.
Considering this as duplicate of markerimage, hence closing the same.
—
Vishwas R
Team CanvasJSIn the link that you have shared, there are couple of issues because of which image is not being shown. Please find them addressed below.
1. Image for the 1st datapoint is not shown as markerImageUrl is not passed to it. Passing markerImageUrl works fine.
{"y":"","label":125, "markerImageUrl":"https:\/\/soundoflife.in\/audiology\/images\/less-than.png"}2. Images are not being shown in 2nd chart as imageUrl property is being stored in 2nd dataseries of the chart but while passing it as src, you are trying to read it from 1st dataseries. Reading it from 2nd dataseries works fine in this case. Please find the code-snippet below.
function addMarkerImages1(chart1) {
  for (var i = 0; i < chart1.data[1].dataPoints.length; i++) {
    Markers.push($("<img>").attr("src",chart1.data[1].dataPoints[i].ImageUrl)
      .css("display", "none")
      .css("height", 20)
      .css("width", 20)

      .appendTo($("#chartContainer1>.canvasjs-chart-container"))
    );
    positionMarkerImage1(Markers[i], i);
  }
}
If you are still facing issue, kindly create JSFiddle reproducing the issue you are facing and share it with us so that we can look into the code, understand the scenario better and help you out.
—
Vishwas R
Team CanvasJSMarch 23, 2021 at 6:44 pm in reply to: Y-Axis label for baseline is hidden when using axisY.minimum #33646Label are shown at a value which is multiple of interval. To show label at the bottom of y-axis, you can add a stripline & set it’s label-placement to outside. Below is the code snippet showing the same.
var axisY = chart.axisY;
axisY.addTo("stripLines", {
  value: axisY.viewportMinimum,
  label: axisY.viewportMinimum,
  labelPlacement: "outside",
  labelFontColor: axisY.labelFontColor,
  color: axisY.tickColor,
  labelBackgroundColor: chart.backgroundColor,
  thickness: 0
});
Please take a look at this JSFiddle for complete code.
—
Vishwas R
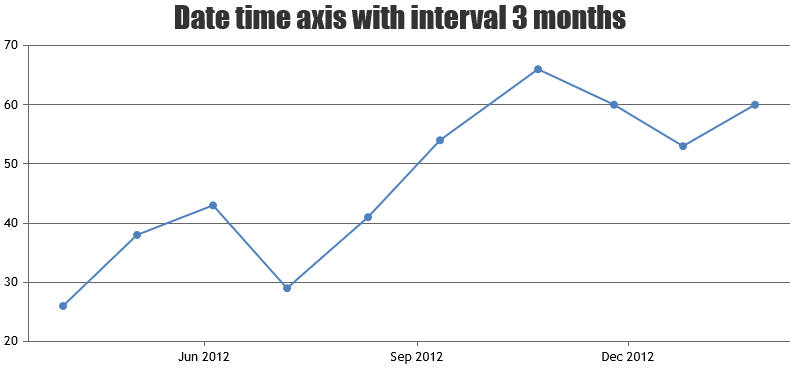
Team CanvasJSWhen x-values are not passed, it takes numeric values 0,1,2,3,… In case of numeric axis, intervalType will be number. To set 12 hours interval, you will have to use date-time axis with
interval: 12, intervalType:"hours". Else if you like to go with numeric-data, you can set theinterval: 12if it’s hourly data.
—
Vishwas R
Team CanvasJSYou can pass dataPoints to the chart as
[{x: 1, y: 10}, {x: 2, y: 20},...}. Please refer this documentation page for more information on the data format accepted by CanvasJS.Also please refer to the code available in the Gallery page for an example on reading data for multiple charts from single JSON file.
—
Vishwas R
Team CanvasJS