Login to Ask a Question or Reply
You must be logged in to post your query.
Home › Forums › Chart Support › StockChart with Tooltip & Crosshair Syncing in react
StockChart with Tooltip & Crosshair Syncing in react
- This topic has 3 replies, 2 voices, and was last updated 5 years, 3 months ago by
Vishwas R.
-
March 11, 2021 at 12:59 am #33185
`
const Chart = () => {
return (
<CanvasJSChart
options = {{
title: {
text: ‘Environment Logs’
},
charts: [{
toolTip: {
shared: true
},
axisY: {
title: ‘Prices’,
prefix: ‘$’,
crosshair: {
enabled: true,
snapToDataPoint: true
}
},
axisX: {
crosshair: {
enabled: true,
snapToDataPoint: true
}
},
data: [{
type: ‘candlestick’,
dataPoints: [
{ x: new Date(“2016, 01, 01”), y: [36.040001, 37.500000, 35.790001, 36.950001] },
{ x: new Date(“2016, 02, 01”), y: [37.099998, 39.720001, 37.060001, 39.169998] },
{ x: new Date(“2016, 03, 01”), y: [38.669998, 39.360001, 37.730000, 38.820000] },
{ x: new Date(“2016, 04, 01”), y: [38.869999, 39.669998, 37.770000, 39.150002] },
{ x: new Date(“2016, 05, 01”), y: [39.099998, 43.419998, 38.580002, 43.209999] },
{ x: new Date(“2016, 06, 01”), y: [43.209999, 43.889999, 41.700001, 43.290001] },
{ x: new Date(“2016, 07, 01”), y: [43.250000, 43.500000, 40.549999, 40.880001] },
{ x: new Date(“2016, 08, 01”), y: [40.849998, 41.700001, 39.549999, 40.610001] },
{ x: new Date(“2016, 09, 01”), y: [40.619999, 41.040001, 36.270000, 36.790001] },
{ x: new Date(“2016, 10, 01”), y: [36.970001, 39.669998, 36.099998, 38.630001] },
{ x: new Date(“2016, 11, 01”), y: [38.630001, 42.840000, 38.160000, 40.380001] }
]
}]
},{
data: [{
type: “column”,
yValueFormatString: “##,%”,
axisYtype: “secondary”,
name: “Proportion”,
dataPoints: [
{ x: new Date(“2016, 01, 01”), y: 71 },
{ x: new Date(“2016, 02, 01”), y: 55},
{ x: new Date(“2016, 03, 01”), y: 50 },
{ x: new Date(“2016, 04, 01”), y: 65 },
{ x: new Date(“2016, 05, 01”), y: 95 },
{ x: new Date(“2016, 06, 01”), y: 68 },
{ x: new Date(“2016, 07, 01”), y: 28 },
{ x: new Date(“2016, 08, 01”), y: 34 },
{ x: new Date(“2016, 09, 01”), y: 14},
{ x: new Date(“2016, 10, 01”), y: 59},
{ x: new Date(“2016, 11, 01”), y: 90}
]
}]
}]
}
}
/>
);
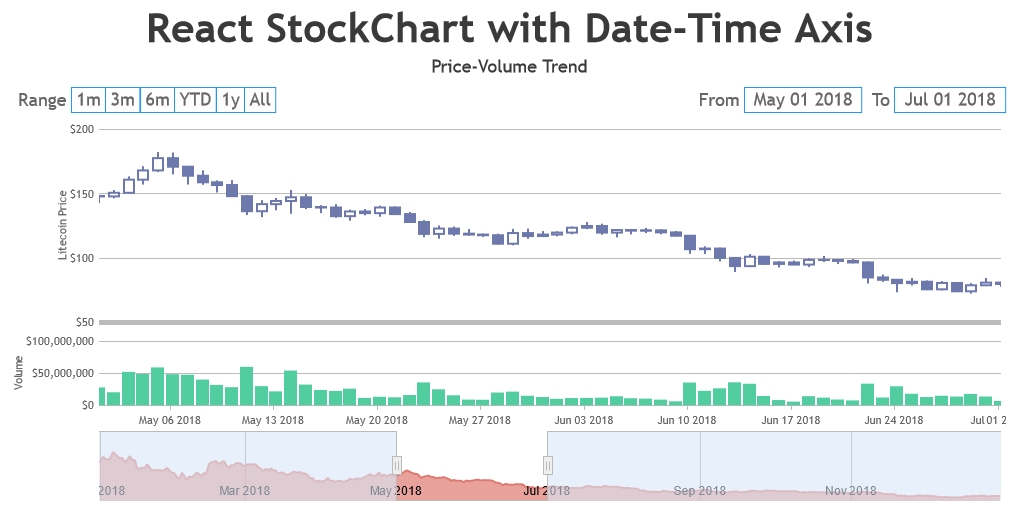
};`I am referring to the chart from https://canvasjs.com/javascript-stockcharts/stockchart-tooltip-crosshair-syncing/.
I would like to render the graph looking like the link.
Can anybody help me to figure this out?
Thank you.
March 11, 2021 at 3:50 pm #33206StockCharts comes with synchronizing tooltip & crosshair as an inbuild feature. You can use our react-component to add StockCharts to your react app. Please refer to React Gallery Section for examples on React StockCharts. Also refer to this demo page for an example on adding multiple charts with date-time axis in React StockChart.
—
Vishwas R
Team CanvasJSMarch 11, 2021 at 9:57 pm #33225I have referred to the graphs from the link you gave. However, it does not work. Can you see why? I am using exactly what the React StockChart does.
March 12, 2021 at 7:01 pm #33232React samples are working fine. Please follow the below steps to add CanvasJS StockChart to your app.
1. Save canvasjs.stock.react.js and canvasjs.stock.min.js within source-folder of your React application ( src or src/assets or src/lib )
2. Import the StockChart component to your app.
import CanvasJSReact from './canvasjs.stock.react';
Please refer to this documentation page for step-to-step tutorial on integrating CanvasJS in react app. Also checkout this Stackblitz demo for working code.If you are still facing issue, kindly share the sample project with us over Google-Drive or Onedrive so that we can look into the code, understand the scenario better and help you out.
—
Vishwas R
Team CanvasJS
You must be logged in to reply to this topic.