Login to Ask a Question or Reply
Forum Replies Created by Vishwas R
-
[UPDATE]
We’ve fixed this issue in the latest build. Please, do download the latest version and let us know your feedback.Whenever you move finger / pointer on the chart, the chart has to know if you are trying to scroll or interact with the chart. Hence we have implemented a behavior where if you hold the finger for a while on the chart, it captures the event and doesn’t scroll. On the other hand, if you move pointer / finger quickly without pausing, it allows you to scroll. Can you try as mentioned above and let us know?
Also, can you please let us know your Device Model, OS, and Browser Version?
-
This reply was modified 9 years, 1 month ago by
Bivek Singh.
August 16, 2016 at 10:20 am in reply to: Problems with shift function to delete array: dataPoints.shift #11770You can hide / unhide dataSeries based on click of legends. Please refer to this documentation page for step-to-step tutorial on the same.
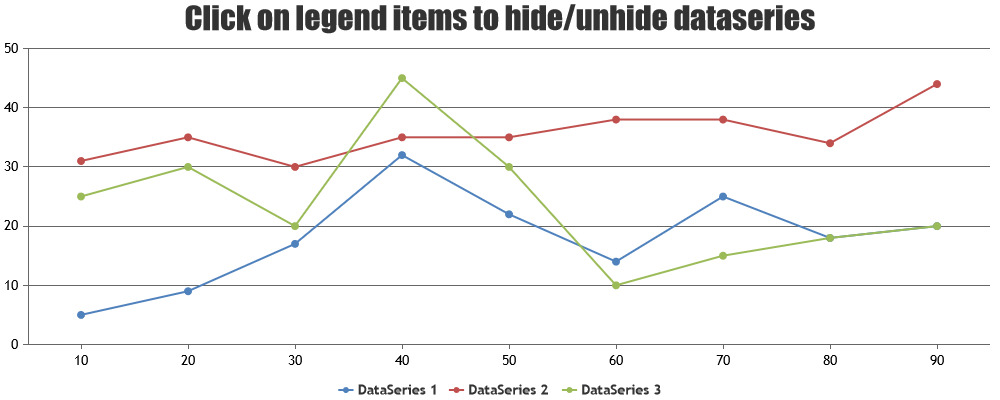 .
.—
Vishwas R
Team CanvasJSAugust 12, 2016 at 11:12 am in reply to: Zoom / Pan button default to pan with multiple charts #11754Crees,
When you have multiple charts in a page, there will be multiple childElement (zoom/pan buttons). So automatically clicking all childElement will solve the issue.
var parentElement = document.getElementsByClassName("canvasjs-chart-toolbar");
var childElement = document.getElementsByTagName("button");
for(var i=0;i<childElement.length;i++){
  if(childElement[i].getAttribute("state") === "pan"){
    childElement[i].click();
  }
}
Here is updated example.
Yes, its possible to update data for every ‘n’ seconds (10seconds in your case). Initially you can render chart with first set of data from an external JSON or the data received from the php service. And while updating you can fetch data from new source where new set of data is present and re-render the chart with new set of data. Here is an example.
Ernest,
It seems that the ArrayList you are storing is not string and result (2016-08-04 = 2004) is calculated at that instance and stored. Storing string within the array-list would solve the issue.
If your arraylist looks like
al4 = [2016-07-25, 2016-07-26, 2016-08-01, 2016-08-02, 2016-08-03, 2016-08-04, 2016-08-05, 2016-08-08, 2016-08-09, 2016-08-10];changing it toal4 = ["2016-07-25", "2016-07-26", "2016-08-01", "2016-08-02", "2016-08-03", "2016-08-04", "2016-08-05", "2016-08-08", "2016-08-09", "2016-08-10"];would solve the issue.Ernest,
We observe that the array you are passing for labels are numbers and not string. If you like to display it as 2016-08-04 in label, store it as a string(“2016-08-04”). As its not a string, its considered as number and the result of 2016-08-04(2004) as been considered and assigned to label.
Change the array to [“2016-07-25”, “2016-07-26”, “2016-08-01”, “2016-08-02”, “2016-08-03”, “2016-08-04”, “2016-08-05”, “2016-08-08”, “2016-08-09”, “2016-08-10”]. And it works fine.
In that case I would suggest filtering dataPoints to something below 10K because column charts are not meant to handle such large Data Sets. In any case when you have large number of dataPoints, columns will overlap and only a few (equal to number of pixels horizontally) of them would be visible. So you can filter them initially and then add more dataPoints when user zooms into a region using rangeChanging. Here is an example.
Ulee,
We are unable to reproduce the issue as the parameters passed to function are not known. Can you please create a jsfiddle with the issue, so that we can look into it and help you in resolving?
August 9, 2016 at 10:43 am in reply to: Something wrong about the stackedArea and the div display #11718Ernest.
In stacked charts, dataPoints for each series are stacked one on top of the other. You can use area chart to show “Second Quarter” data independent of “First Quarter” data.

Claus,
Including jquery will solve the issue, as $(document).ready is used. Or you can use window.onload event.
Check this jsfiddle for working code.
Claus,
You can store the received JSON data in a variable, parse it to the format CanvasJS accepts and pass it to chart data. Here is an example.
Prasanna,
When stripLines are placed too closer, you can change the position of stripline-label far/center/near the axis so as to avoid overlapping using labelAlign property, which defaults to ‘far’. Here is an example.
Akhil,
We observe that the labels are shown for every dataPoints.
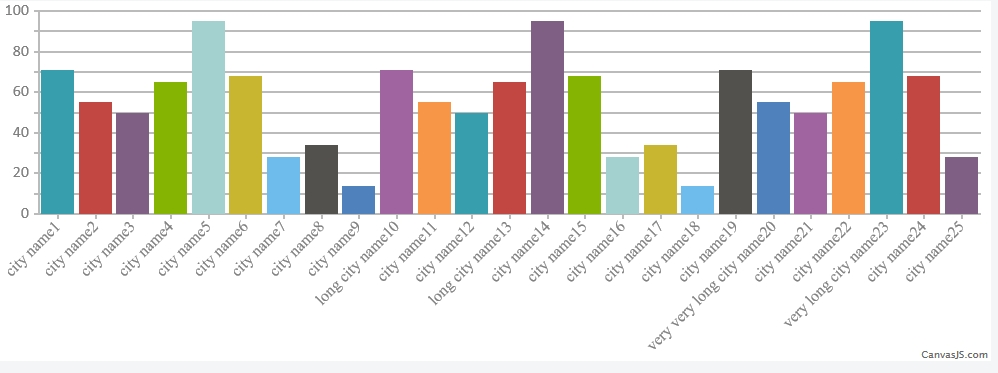
If there are more number of dataPoints, its better not to show every labels, which can be controlled by setting interval, and show few to make it look better or by increasing the chart width, labels get more space and can be shown better.Suggestion: Compared to labelAngle: 90, setting it to -45 makes it much readable. Check this JSFiddle.
—
Vishwas R
Team CanvasJS -
This reply was modified 9 years, 1 month ago by