Login to Ask a Question or Reply
Forum Replies Created by Suyash Singh
-
Archange,
Are you looking for something like this? If this doesn’t suit your requirements, please brief us more about your requirements or provide some pictorial representation so that we can understand it better & help you out.
__
Suyash Singh
Team CanvasJSlabelFormatter is a custom function whereas
suffixis a property within the axis object. Using the labelFormatter as:axisY:{ labelFormatter: function ( e ) { return e.value + "K"; } }should work fine in your case. You could also use
suffixproperty within the axis to achieve the same. Please have a look at suffix.___
Suyash Singh
Team CanvasJSAre you looking for viewportMinimum & viewportMaximum? If this doesn’t suit your requirements, can you please brief us more about your requirements so that we can understand it better & help you out.
__
Suyash Singh
Team CanvasJSSince subtitles is an array, using it as
chart.options.subtitles[0].verticalAlign = "center";should work fine.___
Suyash Singh
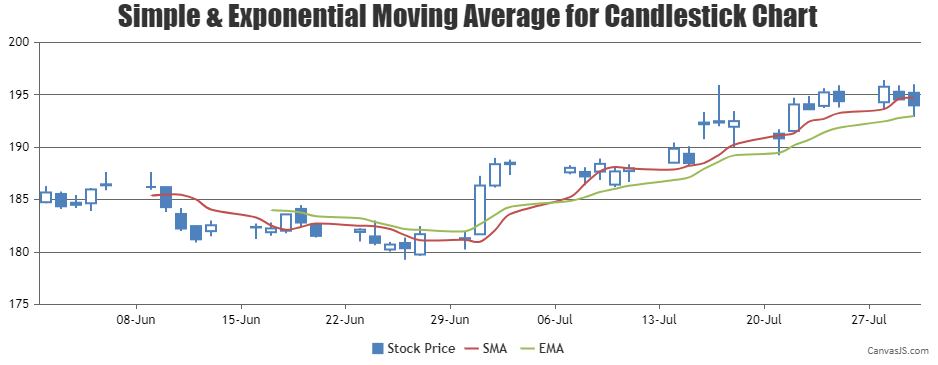
Team CanvasJSNovember 16, 2017 at 1:15 pm in reply to: combining candlestick chart and line chart (moving average line) #176051) what js code would be right for having Exponential Moving Averages instead of SMA.
Yes, you can extend the code further to render Exponential Moving Averages. Please check the below code snippet for calculating Exponential Moving Averages –
function calculateExponentialMovingAverage(chart, emaPeriod) {
  var currentEma = 0, prevEma = 0, temp = 0;

  // Return if there are insufficient dataPoints
  if(chart.options.data[0].dataPoints.length <= emaPeriod) return;

  else {
    chart.options.data.push({
      type: "spline",
      markerSize: 0,
      name: "EMA",
      yValueFormatString: "#,##0.00",
      showInLegend: true,
      dataPoints: []
    });
    for(var i = emaPeriod - 1; i < chart.options.data[0].dataPoints.length; i++) {
      if(i === emaPeriod - 1) {
        // Calculate Simple average upto emaPeriod
        for(var j = 0; j < emaPeriod; j++)
          temp += chart.options.data[0].dataPoints[j].y[3];
        currentEma = temp / emaPeriod;
      } else
        currentEma = chart.options.data[0].dataPoints[i].y[3] * 2 / (emaPeriod + 1) + prevEma * (1 - 2 / (emaPeriod + 1));

      chart.options.data[chart.options.data.length - 1].dataPoints.push({
        x: chart.options.data[0].dataPoints[i].x,
        y: currentEma
      });
      prevEma = currentEma;
    }
  }
}
Also, kindly take a look at this updated JSFiddle.
2) I need 5 EMAs. So I think I can pass those many json datasets in the way you have specified. Right?
Yes, you can add multiple EMA’s to the chart by adding them to data-series array.

___
Suyash Singh
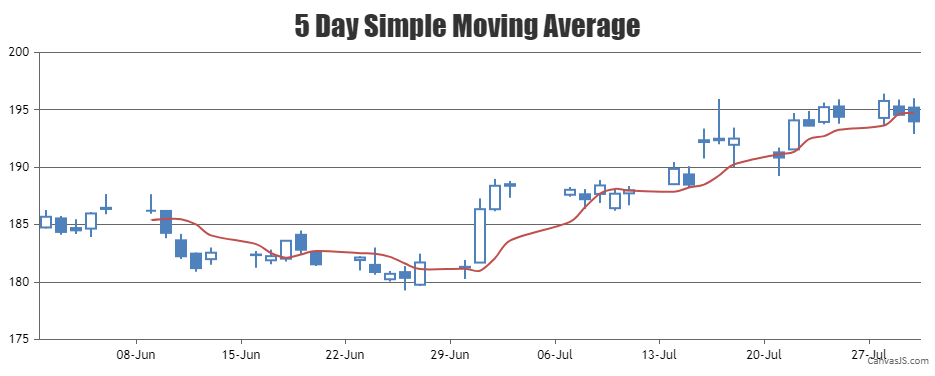
Team CanvasJSNovember 15, 2017 at 12:13 pm in reply to: combining candlestick chart and line chart (moving average line) #17580Thank you for your interest in CanvasJS.
Yes, it can be done. You can combine Candlestick chart with Spline chart, where spline represents the moving averages. You can loop through the candlestick series and use its corresponding dataPoints to dynamically calculate the spline series as shown in the code snippet below –function calculateMovingAverage(chart) { // return if there are insufficient dataPoints if(chart.options.data[0].dataPoints.length <= 5) return; else { // Add a new line series for Moving Averages chart.options.data.push({ type: "spline", markerSize: 0, name: "SMA", dataPoints: [] }); var total; for(var i = 5; i < chart.options.data[0].dataPoints.length; i++) { total = 0; for(var j = (i - 5); j < i; j++) { total += chart.options.data[0].dataPoints[j].y[3]; } chart.options.data[1].dataPoints.push({ x: chart.options.data[0].dataPoints[i].x, y: total / 5 }); } } }Please have a look at this JSFiddle for a working example.

___
Suyash Singh
Team CanvasJSNovember 15, 2017 at 10:11 am in reply to: create dynamic line chart use interval to make axisY move #17575Vineet Deodhar,
Thank you for your interest in CanvasJS. This forum is only for technical queries. Please, contact sales[at]canvasjs.com for license-related queries.
___
Suyash Singh
Team CanvasJSNovember 14, 2017 at 9:39 am in reply to: create dynamic line chart use interval to make axisY move #17552The interval you are setting for axisY is small, which is why labels start overlapping after a few updates. Setting interval to a larger value or letting CanvasJS handle it automatically (by commenting out the interval) should work fine in your case.
___
Suyash Singh
Team CanvasJSNovember 13, 2017 at 10:23 am in reply to: create dynamic line chart use interval to make axisY move #17530