Login to Ask a Question or Reply
Forum Replies Created by Suyash Singh
-
Updating
xVal = t;in your jsfiddle byxVal = t + ms;should work in your case.
Please have a look at this updated jsfiddle.
___
Suyash Singh
Team CanvasJSAre you trying to change axisX.maximum? Also, can you kindly brief what do you mean by:
I also don’t want to show it like time value, I need to show normal number
If you want to increase the maximum axisX / axisY you can do so by using the set method:
chart.axisX[0].set("maximum", 1000);If this doesn’t suit your requirements, kindly create a jsfiddle reproducing the issue you are facing or provide us some pictorial representation so that we can understand your requirements better & help you out.
___
Suyash Singh
Team CanvasJSDecember 4, 2017 at 7:07 pm in reply to: On exporting canvas it output an image with empty graphs #17847You can achieve the same by using valueFormatString for axisX & axisY. If this doesn’t suit your requirements, Can you please create a jsfiddle with sample data you are getting from your API?
___
Suyash Singh
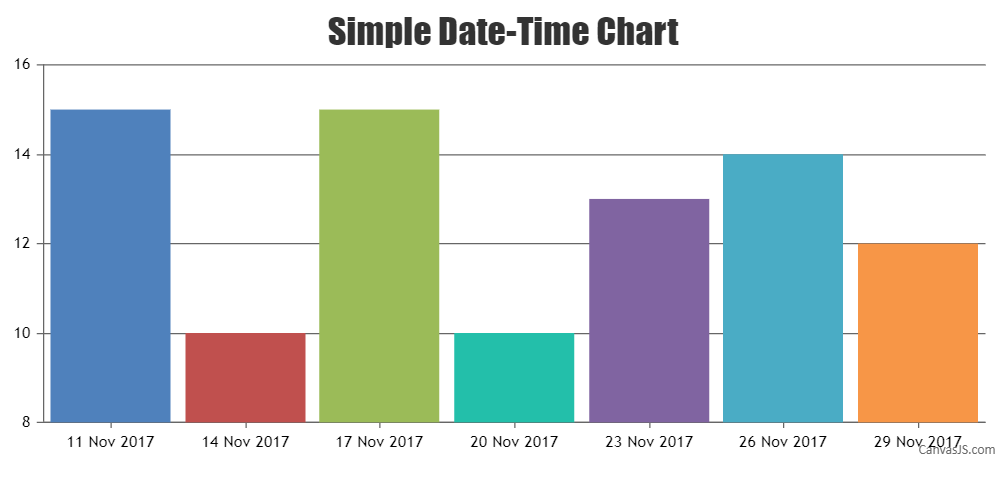
Team CanvasJSDecember 1, 2017 at 1:27 pm in reply to: Uncaught TypeError: Cannot read property 'getTime' of undefined #17818dataPoints is an array of objects. But as per the code shared above, it seems like you are passing a string
("{x: new Date(2017, 10, 20),y: 10},{x: new Date(2017, 10, 17),y: 15}") to dataPoints array instead of objects. Therefore, parsing the data and converting it to objects like{x: new Date(2017, 10, 20),y: 10},{x: new Date(2017, 10, 17),y: 15}should work fine in your case. Here is an example you can refer.If this doesn’t suit your requirements, Can you please create a JSFiddle, along with your sample data, reproducing the issue?
___
Suyash Singh
Team CanvasJSEve,
You can use toolTip.contentFormatter event for the same. Please have a look at this jsfiddle.
___
Suyash Singh
Team CanvasJSAlexander,
You can place the title in the center by setting the following properties within in the title object: dockInsidePlotArea to
true& verticalAlign to"center".
Please have a look at this updated jsfiddle.___
Suyash Singh
Team CanvasJSDivya,
Thanks for your interest in CanvasJS. Please send license related queries to sales[at]canvasjs[dot]com and the sales team will surely assist you.
—
Suyash Singh
Team CanvasJSThanks for the suggestion we will consider it for the future versions.
___
Suyash Singh
Team CanvasJSGayle,
You can download the commercial version of the library from “My Account” Page. Replacing the trial version of library in your project with the downloaded commercial version (canvasjs.min.js file) will remove the trial version text. We suggest you to clear the browser cache after replacing the script.
If you are still facing issue in downloading commercial version or for further license related queries, please contact sales[at]canvasjs[dot]com.
___
Suyash Singh
Team CanvasJSCristian,
We are looking into it & will get back to you at the earliest.
___
Suyash Singh
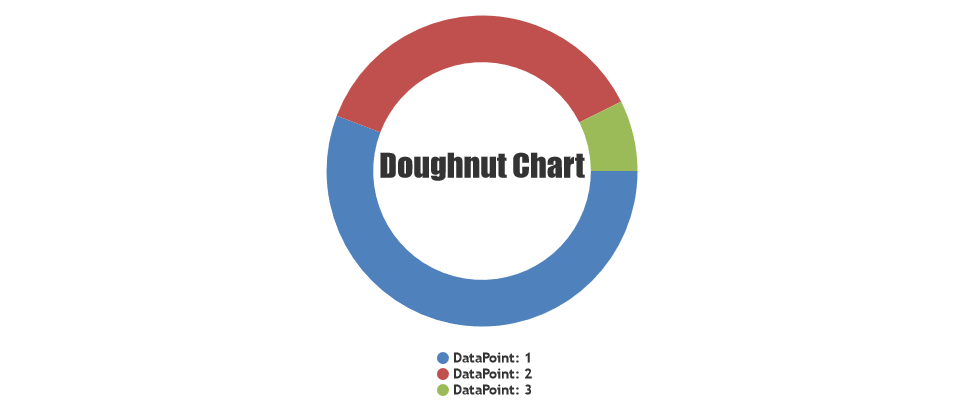
Team CanvasJSAlexander,
You can place title inside Doughnut chart by using verticalAlign. Please have a look at this JSFiddle.
___
Suyash Singh
Team CanvasJSAlexander,
You can place title inside Doughnut chart by using verticalAlign. Please have a look at this jsfiddle.
___
Suyash Singh
Team CanvasJS