Login to Ask a Question or Reply
Forum Replies Created by Suyash Singh
-
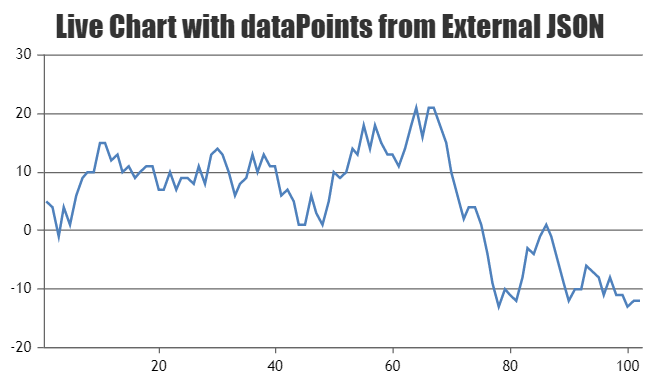
You are getting a static chart because the JSON provided is static. For making the chart dynamic please have a look at this tutorial on creating live Updating Charts from JSON.

—
Suyash Singh
Team CanvasJSThe legendText was showing NaN because the JSON you were using didn’t had
valueyin the last object.
{"valuex":"2017-02-20 17:44:36"}
Also the legendText had a redundant 0 in front of it, becausevalue(a number) was concatenated to a stringdeltaX.
value = value + deltaX;
You will need to initialize value as an empty string. To format the the legend text you can use CanvasJS.formatDate() with"YYYY-MM-DD hh:mm:ss:fff"valueFormatString. Please check this updated JSFiddle.__
Suyash Singh
Team CanvasJS-
This reply was modified 9 years ago by
Suyash Singh. Reason: indent
If you don’t set any indexLabel / label for the dataPoints / dataSeries, they are not shown by default. Please refer this jsfiddle.
__
Suyash
Team CanvasJSFebruary 22, 2017 at 3:23 pm in reply to: Need for dataPoints in column chart with same X value to be stackedColumn #14383In stackedColumn, dataPoints with same x-values will stack one on top of another. So by setting type to ‘stackedColumn’ will work fine in your case (with single dataSeries also). Please check this updated jsfiddle.
—
Suyash
Team CanvasJSFebruary 22, 2017 at 11:18 am in reply to: Need for dataPoints in column chart with same X value to be stackedColumn #14381You can programmatically zoom into an axis range by using ViewPortMinimum and viewPortMaximum. Reset button won’t work since the viewPortMaximum / viewPortMinimum values were not set manually (mouse click and drag). So you will have to take care of zoom out on click of reset button. Please check this jsfiddle.
__
Suyash,
Team CanvasJSClaus,
You can keep a copy of dataSeries in separate array, excluding the ones which you have considered as an error situation, and passing that to chart will work fine in your case. Please refer this jsfiddle.
—
Suyash,
Team CanvasJSAshish Potdar,
The dataPoints you pass to the chart must be an array of objects and not a string.
You can use timestamp values for X Axis as it would be easier to convert them to valid JSON before parsing and passing them to the chart. Please refer this jsfiddle.
For further reference you can go through these links:
1. Date Time Axis.
2. MDN’s Date reference
3. W3Schools Date reference—
Suyash
Team CanvasJSYou can get the reference of the chart object outside of the window.onload() or any other function by either creating chart as a global variable, which is not a neat way to access the chart. Or you could pass the chart object as a parameter to the function that can access the chart as shown in this jsfiddle.
—
Suyash,
Team CanvasJSThe dataPoints in your chart are scrambled as the dataPoints parsed from the JSON aren’t sorted. As mentioned in previous reply, sorting the datapoints should work fine in this case. Please take a look at this JSFiddle.

__
Suyash,
Team CanvasJSThe dataPoints you pass to the chart must be an array of objects and not a string.
var MyVal = (document.getElementById('txtGrpValue').value); \\ StringFirst you need to parse the string you get from your input field to a valid JSON and then parse the JSON to get the object which you can pass to the chart. For converting the string to valid JSON, you can either enclose the values x and y in quotes in the input field and remove the semicolon like this example. Or you could use regular expression as shown in this example.
—
Suyash
Team CanvasJSYou can permanently highlight the maximum dataPoint in a graph by setting its color that is highlighted and setting the highlightEnabled property of the datapoint to false.
Please check this jsfiddle.
—
Suyash
Team CanvasJS -
This reply was modified 9 years ago by