Login to Ask a Question or Reply
Forum Replies Created by Shashi Ranjan
-
We are looking into your query and will get back to you at the earliest.
____
Shashi Ranjan
Team CanvasJSThanks for the JSFiddle. We are looking into your query and will get back to you at the earliest.
____
Shashi Ranjan
Team CanvasJSYou can definitely go ahead with this approach but we will check from our end and let you know.
____
Shashi Ranjan
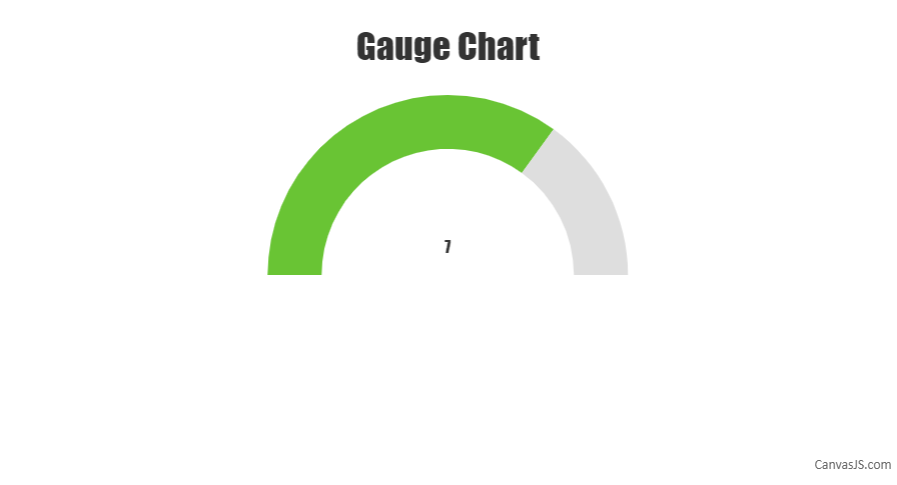
Team CanvasJSSorry, we don’t have a gauge chart as of now but a semi doughnut chart can be used to create it. Please below the steps below for creating a gauge chart using a doughnut chart.
First, we need to create an object that will store all the necessary data that is needed to be shown on the gauge chart. The code snippet below shows an example of that object:
var gauge = {
  title:{text: "Gauge Chart"},
  data: { y: 7 }, //gauge value
  maximum: 10
};
In the second step, we will initialize the chart object and populate its dataPoints considering the fact that only half of the doughnut chart be displayed. Please refer to the code snippet below for achieving the same:
var chart = new CanvasJS.Chart("chartContainer");
createGauge(chart);

//Function for gauge
function createGauge(chart){
  //Caluculation of remaining parameters to render gauge with the help of doughnut
  gauge.unoccupied = {
    y: gauge.maximum - gauge.data.y ,
    color: "#DEDEDE",
    toolTipContent: null,
    highlightEnabled: false,
    click : function (){ gauge.unoccupied.exploded = true; }
  }
  gauge.data.click = function (){ gauge.data.exploded = true; };
  if(!gauge.data.color)
    gauge.data.color = "#69C434";
  gauge.valueText = {text: gauge.data.y.toString(), verticalAlign :"center"};

  var data = {
    type: "doughnut",
    dataPoints: [
      {
        y: gauge.maximum ,
        color: "transparent",
        toolTipContent: null
      },
      gauge.data,
      gauge.unoccupied
    ],
  };

  if(!chart.options.data)
    chart.options.data = [];
  chart.options.data.push(data);

  if(gauge.title){
    chart.options.title = gauge.title;
  }

  //For showing value
  if(!chart.options.subtitles)
    chart.options.subtitles = [];
  chart.options.subtitles.push(gauge.valueText);

  chart.render();
}
You can also refer to take a look at this JSFiddle for a working example with sample code.

—
Shashi Ranjan
Team CanvasJSFebruary 4, 2019 at 8:35 pm in reply to: CanvasJs React – Cannot assign to read only property 'exports' of object #24205Thanks for reporting the issue, we will work on it and fix it in our future releases.
____
Shashi Ranjan
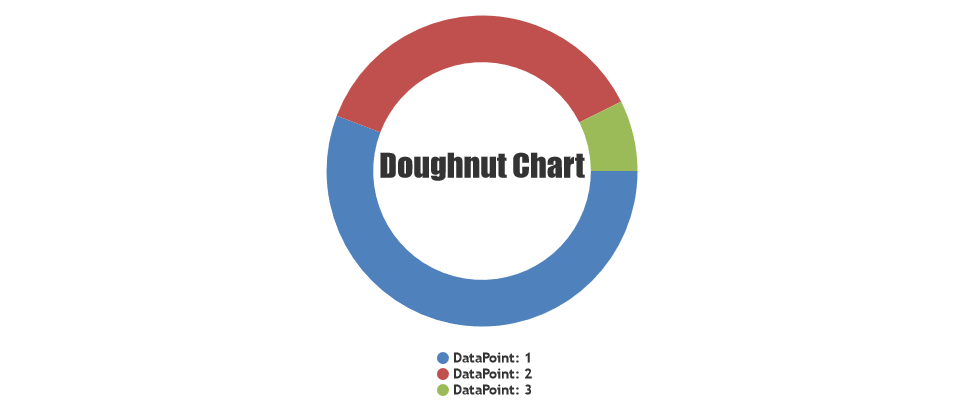
Team CanvasJSYou can use title or subtitles to display text at center of the chart by setting its property verticalAlign to “center” and dockInsidePlotArea to true. Below is the code snippet for the same.
title:{
	text: "Doughnut Chart",
	verticalAlign: "center",
	dockInsidePlotArea: true
},
Please take a look at this JSFiddle for complete code.

____
Shashi Ranjan
Team CanvasJSJanuary 31, 2019 at 10:33 pm in reply to: Canvas js is showing single line as bar data for Multi Series Range Column Chart #24187Chart seems to be working fine with all the sets of dataPoints that you have shared. Can you kindly create a JSFiddle reproducing the issue you’re facing so that we can look into the code, understand it better and help you out?
____
Shashi Ranjan
Team CanvasJSCan you please create a JSFiddle reproducing the issue you’re facing so that we can look into the code, understand it better and help you out?
____
Shashi Ranjan
Team CanvasJSThe image quality can be improved further by editing the source code of CanvasJS. You can purchase a license from our license page to get access to the source code. Once you have purchased the license please let us know and we will help you out with a solution.
____
Shashi Ranjan
Team CanvasJSYou can achieve the above requirement by using stripLines at desired points on the Axis Y as shown in this JSfiddle.
____
Shashi Ranjan
Team CanvasJSYou can achieve the above requirement by using CanvasJS formatDate() method to format the date and time values in the variable firstday and lastday as shown in this JSFiddle.
____
Shashi Ranjan
Team CanvasJSCan you kindly create a JSFiddle reproducing the issue you are facing and share it with us along with the sample data so that we can look into the code and chart-options being used by you to understand the scenario better and help you out?
From what we have observed, sometimes things get delayed mostly when we are not able to reproduce the issue or not able to understand the exact requirements or the solution that we provide may not work properly due to the variation in chart-options being used by you and us.
Having a JSFiddle helps us in figuring out the issue and suggesting an appropriate solution accordingly.
____
Shashi Ranjan
Team CanvasJS