Login to Ask a Question or Reply
Forum Replies Created by Sanjoy
-
Hi,
In this case you have to assign x value also or you need to increase auto assigned x value for each dataPoints. Please check this example.
Thijs,
1) It’s the actual behavior of spline curve but we will reconsider it again.
2) And setting toolTipContent to null will help you to disable toolTip for a particular dataSeries.Elina,
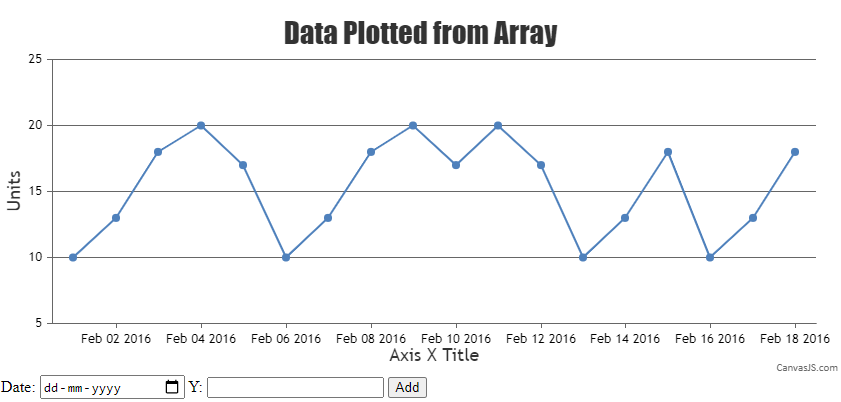
To render the dataPoint with one array for x value and other array for y values, you need to parse the arrays according to data format accepted by CanvasJS. Check out the below code snippet for parsing the arrays.
function parseDataPoints() {
  for (var i = dps.length; i < dateArray.length; i++)
    dps.push({
      x: new Date(dateArray[i]),
      y: numberArray[i]
    });
};
Please take a look at this JSFiddle for complete code sample.

—-
Sanjoy Debnath
Team CanvasJSJune 22, 2016 at 8:35 pm in reply to: How To Determine The Intersection Point Between a Curve And a Line #11429We are using Bezier Curve for drawing Spline Curve. Am not able to find a way to know intersection point of spline and line. But you can look into the function renderSpline & getBezierPoints in our source code (canvasjs.js) for more information on the same.
Any kind of progress indicator is compatible with CanvasJS. Here is a blog to show progress indicator for an ajax request.
For displaying live data from database you need to create
1. A PHP service (or any other server side technology) that returns data in JSON format to CanvasJS,
2. HTML page that does AJAX request after certain interval to the server and fetches the data. After getting the data, it will render the updated chart.Here is a similar example to implement the same in client side.
Also refer this thread.
June 17, 2016 at 3:54 pm in reply to: How To Determine The Intersection Point Between a Curve And a Line #11397Are you looking for markerColor with Scatter Chart. And it is not possible to access internal functions of library.
June 16, 2016 at 6:00 pm in reply to: How To Determine The Intersection Point Between a Curve And a Line #11392jproduction,
Sorry we don’t have this feature. You need to find it out mathematically.
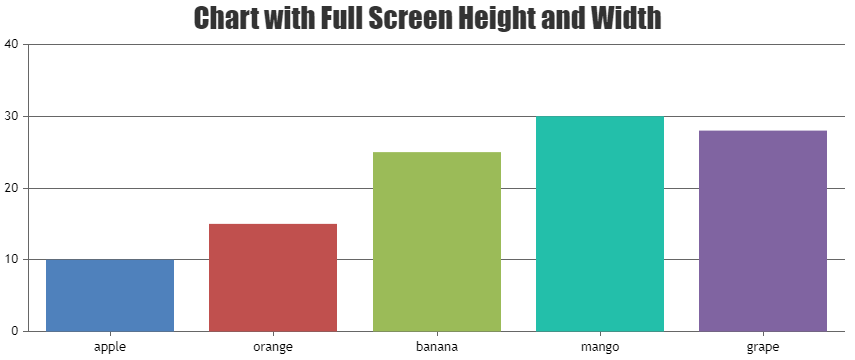
Here it is a generic case to set height of any HTML div 100%. By setting height to 100% chart will take immediate parent container’s height, in this case you have to specify height of the parent container. Still if you want to show the chart with 100% height of the window with responsiveness you can try by setting the attribute
<div id="chartContainer" style="height: 100%; width: 100%; position: absolute"></div>.Please take a look at this JSFiddle for complete code.

Please refer these threads for more information
[update]
We have just released v1.9.6 Beta with Methods & Properties, which allows you to programmatically access internally calculated values, export chart as image, print chart, etc. Please refer to the release blog for more information.
Please check this jsfiddle.
xiaosongzou,
1) As of now we don’t have width property of label. Using margin you can align the axis of both the chart.
2) For controlling gap between bars you can use dataPointMinWidth.Also you can check interval,viewportMinimum and viewportMaximum for aligning the labels/grid-lines.
Sourav,
Yes you can force to show required labels using labelFormatter. Here is an example.
[update]
We have just released v1.9.6 Beta with Methods & Properties, which allows you to programmatically export chart as image, print chart, access internally calculated values, etc. Please refer to the release blog for more information.
Please check this jsfiddle.
You can do the same for axisY2. Here is updated fiddle with aligning axisY2.
Hi,
As of now this feature is not available in our library. Here is an workaround to align the axis.
elvisximenes,
Can you please post sample of your JSON data.
And for showing 3 lines you have to pass JSON data in the CanvasJS data format with all the 3 dataSeries from server side. Similar as you have done for ‘submited’.-
This reply was modified 9 years, 7 months ago by
Sanjoy.
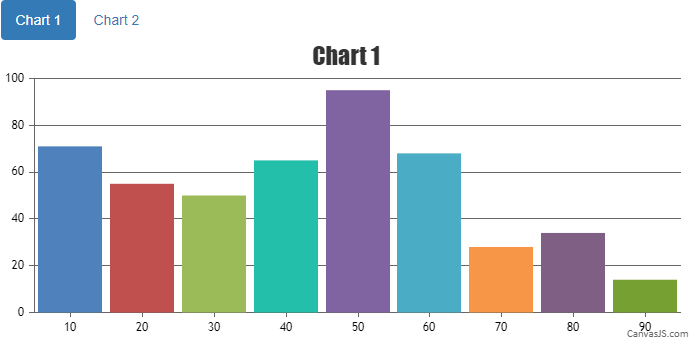
The problem may be due to rendering the chart before even tab is displayed because of which dimensions for the chart are not calculated properly. You can use tab events to initialize and render the respective chart after the tab is displayed as shown in this code snippet.
$('#bs-tab2').on("shown.bs.tab",function(){
  chartTab2();
  $('#bs-tab2').off();
});
Please take a look at this JSFiddle for complete code.

If the problem still persists, please create a JSFiddle. So that we can look into it.
—-
Sanjoy Debnath
Team CanvasJS -
This reply was modified 9 years, 7 months ago by