Login to Ask a Question or Reply
Forum Replies Created by Priyanka M S
-
September 17, 2018 at 4:42 pm in reply to: can we get series minimum and maximum value of datapoints #22630
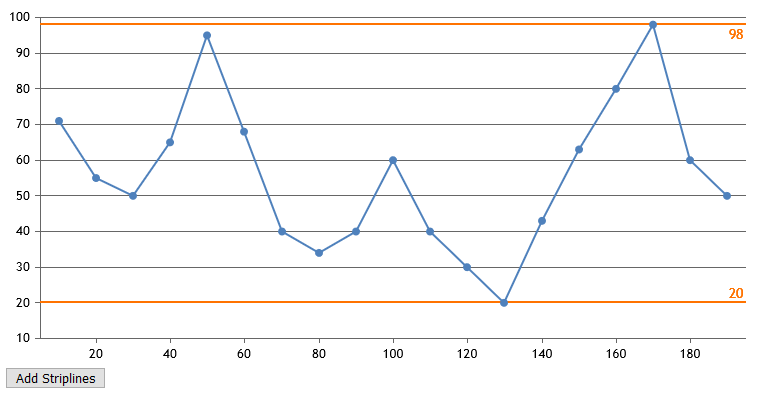
You can calculate the minimum and maximum of dataPoints y-values after updating it dynamically and assign the desired markerType and stripLines to the lowest and highest dataPoint y-values as shown in this jsfiddle.
__
Priyanka M S
Team CanvasJSCanvasJS charts accept only numeric input to Y values of dataPoints.
In the code that you have shared, parsing the data you get from JSON to float using parseFloat should work fine. Please take a look at this jsfiddle.__
Priyanka M S
Team CanvasJSSeptember 17, 2018 at 10:17 am in reply to: The graph loses the centering – a strange right margin #22624You can use interval and intervalType to set the interval in day, month, hour etc.
__
Priyanka M S
Team CanvasJSSeptember 17, 2018 at 10:16 am in reply to: can we get series minimum and maximum value of datapoints #22623Yes, the same logic should work fine to add stripLines at the minimum and maximum dataPoints of a dynamically updating chart.

__
Priyanka M S
Team CanvasJSChanging
includeZero: False,toincludeZero: false,should work fine as boolean values in JavaScript are case-sensitive.__
Priyanka M S
Team CanvasJSSeptember 14, 2018 at 6:42 pm in reply to: change value to chart data update but chart not display data #22604recently, it is properly working kindly check and chart data not updating.
Can you kindly share the updated jsfiddle with the working slider, which would help us understand your code and check why the chart is not getting updated on changing the range of slide?
__
Priyanka M S
Team CanvasJSSeptember 14, 2018 at 11:24 am in reply to: Is it possible to pull the chart title from a CSV file? #22599Please take a look at this updated jsfiddle.
Also, I suggest you to have the country name in every record of CSV source, which will be easier to compare and retrieve the required country’s records among many records.
__
Priyanka M S
Team CanvasJSSeptember 14, 2018 at 10:09 am in reply to: can we get series minimum and maximum value of datapoints #22598You can add striplines at minimum & maximum values dynamically by using addTo method. Please refer the code-snippet below.
chart.axisY[0].addTo("stripLines", { value: minY, label: minY, thickness:2 }, false);
chart.axisY[0].addTo("stripLines", { value: maxY, label: maxY, thickness:2 });
Please take a look at this JSFiddle. for complete code.

__
Priyanka M S
Team CanvasJSYou can use range column chart to achieve this. Please take a look at this jsfiddle.
__
Priyanka M S
Team CanvasJSSeptember 12, 2018 at 6:54 pm in reply to: change value to chart data update but chart not display data #22587In the jsfiddle you have shared, the slider seems to be not working and please check the browser console for the error.
Updating the axis range by updating minimum and maximum of axisX on changing the slider range should work fine in your case. Please refer Updating Chart Options for a tutorial on modifying/updating chart options dynamically.
__
Priyanka M S
Team CanvasJSYou can set valueFormatString to
DDDDto show weekdays in axisX, when it’s date-time axis__
Priyanka M S
Team CanvasJSCan you kindly create and share a sample project over google-drive or one-drive reproducing the issue you are facing, so that we can look into your code, understand it better and help you out?
__
Priyanka M S
Team CanvasJSCan we add a gap between stacked colomns ?
Can you please provide a pictorial representation as to where the gap has to be created so that we can understand your requirement better and help you out?
__
Priyanka M S
Team CanvasJSSeptember 11, 2018 at 6:28 pm in reply to: doughnut chart click function not rendering data from razor view in asp.net mvc #22574Can you kindly share a sample project over google-drive or one-drive reproducing the issue you are facing, so that we can look into your code, understand the scenario better and help you out?
__
Priyanka M S
Team CanvasJS