Login to Ask a Question or Reply
Forum Replies Created by Manoj Mohan
-
August 26, 2019 at 10:24 pm in reply to: How do I individually format legend item text styles? #26557
As of now, it’s not possible to style the text of legend as link (underline).
—-
Manoj Mohan
Team CanvasJSConsidering this thread as a duplicate of Drilldown with Ajax and MVC and hence closing the same.
—-
Manoj Mohan
Team CanvasJSYou can use Scatter Chart with markerType set as circle, square to achieve your requirement.
If this doesn’t fulfill your requirement, kindly share some example / pictorial representation and brief us more about your requirement so that we can understand scenario better and help out.
—-
Manoj Mohan
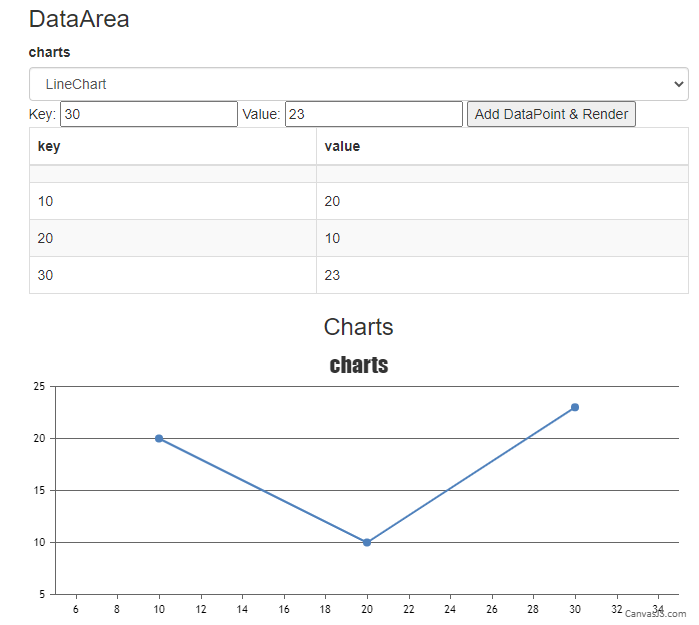
Team CanvasJSAugust 20, 2019 at 7:01 pm in reply to: using drop down how to change charts using user input value #26493There are couple of issue with the code that you have shared.
1. You need to replace
chartTypewithchartinchartType.options.data[0].typeas chartType is referred to dropdown field not the chart object.
chart.options.data[0].type = chartType.options[chartType.selectedIndex].value;2. Below code has to be inside the
window.onloadfunction as chart is insidewindow.onloadscope.var chartType = document.getElementById("chartType"); chartType.addEventListener( "change", function(){ chart.options.data[0].type = chartType.options[chartType.selectedIndex].value; chart.render(); });Please take a look at this JSFiddle for the complete code.

Considering this thread as a duplicate of using drop down how to change charts using user input value and hence closing the same.
—-
Manoj Mohan
Team CanvasJSAugust 20, 2019 at 7:01 pm in reply to: using drop down how to change charts using user input value #26492There are couple of issue with the code that you have shared.
1. You need to replace
chartTypewithchartinchartType.options.data[0].typeas chartType is referred to dropdown field not the chart object.
chart.options.data[0].type = chartType.options[chartType.selectedIndex].value;2. Below code has to be inside the
window.onloadfunction as chart is insidewindow.onloadscope.var chartType = document.getElementById("chartType"); chartType.addEventListener( "change", function(){ chart.options.data[0].type = chartType.options[chartType.selectedIndex].value; chart.render(); });Please take a look at this JSFiddle for the complete code.

—-
Manoj Mohan
Team CanvasJSAugust 19, 2019 at 11:00 am in reply to: using drop down how to change charts using user input value #26323Please take a look at this JSFiddle to change chart type based on the value selected from the dropdown. Similarly, you can change chart options based on selected value from the dropdown.
—-
Manoj Mohan
Team CanvasJSIt seems to be working fine. In order to run an angular app in IE11, you need to modify Browserslist and TypeScript configuration files. In
tsconfig.json, you need to set"target": "es5"and in.browserslistrcfile, replacenot IE 11withIE 11to make angular app compatible with IE11. Please refer this angular docs page for more information.If the issue still persists, please share a sample project over Google-Drive or OneDrive reproducing the issue you are facing, so that we can look into your code, understand the scenario better and help you out?
—-
Manoj Mohan
Team CanvasJSPeter,
Can you please share a sample project along with sample data over Google-Drive or OneDrive so that we can understand your scenario better and help you out?
—-
Manoj Mohan
Team CanvasJSSorry, we don’t have a definite timeline for Radar Chart as of now.
—-
Manoj Mohan
Team CanvasJSYou can render multiple line series in a single chart by adding dataSeries elements to data Array. Please take a look at the below code snippet for the same.
data: [
  {
	type: "line",
	dataPoints: [
	  { x: 10, y: 21 },
	  { x: 20, y: 25},
	  { x: 30, y: 20 },
	  { x: 40, y: 25 },
	  { x: 50, y: 27 },
	  { x: 60, y: 28 },
	  { x: 70, y: 28 },
	  { x: 80, y: 24 },
	  { x: 90, y: 26}
	]
  },
  {
	type: "line",
	dataPoints: [
   	  { x: 10, y: 31 },
   	  { x: 20, y: 35},
   	  { x: 30, y: 30 },
   	  { x: 40, y: 35 },
   	  { x: 50, y: 35 },
   	  { x: 60, y: 38 },
   	  { x: 70, y: 38 },
   	  { x: 80, y: 34 },
   	  { x: 90, y: 44}
	]
   },
   .
   .
   .
]
Also, please take a look at this documentation page for more information on creating multi-series chart.

—-
Manoj Mohan
Team CanvasJSDeepak,
It’s not possible to selectively zoom/pan based on a specific axis. However, this JSFiddle shows the nearest possible working solution using rangeChanging event.
—
Manoj Mohan
Team CanvasJSDeepak,
Sorry, this feature is not available as of now.
—-
Manoj Mohan
Team CanvasJS