Login to Ask a Question or Reply
You must be logged in to post your query.
Home › Forums › Chart Support › using drop down how to change charts using user input value
using drop down how to change charts using user input value
- This topic has 3 replies, 2 voices, and was last updated 6 years, 11 months ago by
Manoj Mohan.
-
August 18, 2019 at 11:55 am #26315
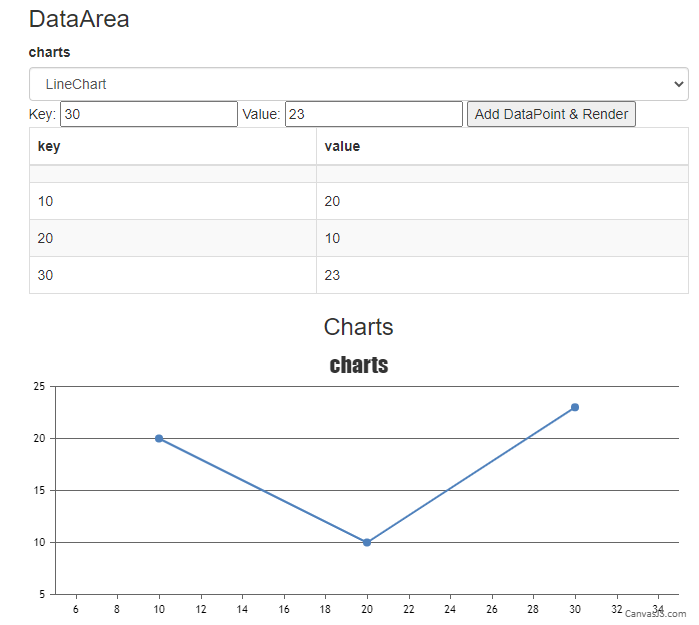
how to change charts using dropdown in jquery .charts want to change with user input values
how can i change.Thank you
August 19, 2019 at 11:00 am #26323Please take a look at this JSFiddle to change chart type based on the value selected from the dropdown. Similarly, you can change chart options based on selected value from the dropdown.
—-
Manoj Mohan
Team CanvasJSAugust 19, 2019 at 11:52 am #26325Hi
I had seen done it but there is an error occurring please give me solutions for it.<html> <head> <meta name="viewport" content="width=device-width, initial-scale=1"> <link href="https://maxcdn.bootstrapcdn.com/bootstrap/3.3.6/css/bootstrap.min.css" rel="stylesheet"> <link href="https://cdnjs.cloudflare.com/ajax/libs/bootstrap-datepicker/1.5.0/css/bootstrap-datepicker.css" rel="stylesheet"> <script src="http://ajax.googleapis.com/ajax/libs/jquery/1.9.1/jquery.js"></script> <script src="https://maxcdn.bootstrapcdn.com/bootstrap/3.3.6/js/bootstrap.min.js"></script> <script src="https://cdnjs.cloudflare.com/ajax/libs/bootstrap-datepicker/1.5.0/js/bootstrap-datepicker.js"></script> <script src="https://cdn.anychart.com/js/8.0.1/anychart-core.min.js"></script> <script src="https://cdn.anychart.com/js/8.0.1/anychart-pie.min.js"></script> <script type="text/javascript" src="https://cdn.canvasjs.com/canvasjs.min.js"></script> <title></title> </head> <body> <div class="container"> <div class="col-md-12"> <div class="col-md-6 form-group"> <h3> DataArea</h3> <label for="select">charts</label> <select class="form-control" id="chartType" name="Chart Type"> <!-- <option> select</option> --> <option value="Barchart" >Barchart</option> <option value="Linechart">LineChart</option> <option value="Pie chart">PieChart</option> </select> <form class="form"> Key: <input id="key" name="text" type="text" value="" placeholder="Enter X-Value" > Value: <input id="value" type="number" step="any" placeholder="Enter Y-Value"> <button id="renderButton" onclick="return highlightDuplicates()">Add DataPoint & Render</button> <table class="table table-bordered table-striped" id="maintable"> <thead> <tr> <th>key </th> <th> value</th> </tr> </thead> <tbody class="tbody"> <tr> <td> </td> <td> </td> </tr> </tbody> </table> </form> </div> <div class="col-md-6 form-group"> <center><b> <h3>Charts</h3></b></center> <div id="chartContainer1" style="height: 270px; width: 100%;"> </div> <div id="chartContainer2" style="height: 270px; width: 100%;"> </div> </div> </div> </div> </body> </html> <script> $(document).ready(function(){ $('form').submit(function(){ var KEY = $('#key').val(); var VALUE = $('#value').val(); var markup = "<tr><td>" + KEY + "</td><td>" + VALUE + "</td></tr>"; $("table tbody").append(markup); return false; }); }); </script> <script type="text/javascript"> window.onload = function() { var dps = []; var chart = new CanvasJS.Chart("chartContainer1", { animationEnabled: true, title: { text: "charts" }, data: [{ type: "bar", dataPoints: dps }] }); function addDataPointsAndRender() { key = Number(document.getElementById("key").value); value = Number(document.getElementById("value").value); dps.push({ x: key, y: value }); chart.render(); } var renderButton = document.getElementById("renderButton"); renderButton.addEventListener("click", addDataPointsAndRender); } var chartType = document.getElementById('chartType'); chartType.addEventListener( "change", function(){ chartType.options.data[0].type = chartType.options[chartType.selectedIndex].value; }); chart.render(); </script>August 20, 2019 at 7:01 pm #26492There are couple of issue with the code that you have shared.
1. You need to replace
chartTypewithchartinchartType.options.data[0].typeas chartType is referred to dropdown field not the chart object.
chart.options.data[0].type = chartType.options[chartType.selectedIndex].value;2. Below code has to be inside the
window.onloadfunction as chart is insidewindow.onloadscope.var chartType = document.getElementById("chartType"); chartType.addEventListener( "change", function(){ chart.options.data[0].type = chartType.options[chartType.selectedIndex].value; chart.render(); });Please take a look at this JSFiddle for the complete code.
—-
Manoj Mohan
Team CanvasJS
You must be logged in to reply to this topic.