Login to Ask a Question or Reply
Forum Replies Created by Manoj Mohan
-
Can you please brief us further about your requirement along with a pictorial representation or an example so that we can understand your scenario better and help you out?
—-
Manoj Mohan
Team CanvasJSvorlontech,
To pass the datapoints variables to html code, you can use json_encode and raw filter of twig. Please take a look at the working code-snippet below.
dataPoints: {{ dataPoints | json_encode(constant('JSON_NUMERIC_CHECK')) | raw }}—
Manoj Mohan
Team CanvasJSvorlontech,
The gallery example that you have shared seems to be working fine and we were not able to reproduce the issue at our end. Can you kindly share a complete code over Google-Drive or Onedrive reproducing the issue you are facing so that we can look into your code, run it locally at our end to understand the scenario better and help you out?
—-
Manoj Mohan
Team CanvasJSCanvasJS is a client-side library and it seems to be working fine with xampp. Please check the error in the browser console or any API which are used to pass the data to the chart.
If you are still facing the issue, kindly create sample project reproducing the issue and share it with us over Google-Drive or Onedrive along with sample data so that we can look into your code, run it locally at our end to understand the scenario better and help you out.
—-
Manoj Mohan
Team CanvasJSYou can render multi-series chart to achieve your requirements. Please take a look at this updated sample project for an example on rendering multi-series chart in PHP with data fetched from database. Also, please refer to this gallery page for an example on multi-series chart in PHP.
—-
Manoj Mohan
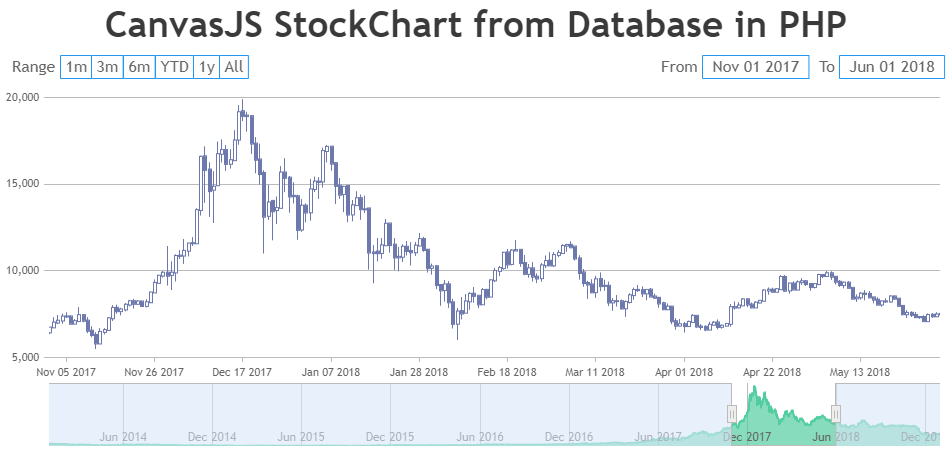
Team CanvasJSPlease take a look at this sample project for an example on rendering CanvasJS StockChart in PHP with data from the MySQL database.
—-
Manoj Mohan
Team CanvasJSKen,
“canvasjs-commercial-3.8.8/jquery.canvasjs.min.js” is a CanvasJS jQuery Plugin which is used to create CanvasJS chart with jQuery library. To create chart using jQuery plugin, please take a look at this documentation page. In the drilldown example, jQuery library is used to bind the click event and you need to include the library either using CDN link or hosted in your server like “/path/jquery.min.js”. Below code should work fine in your case.
<script src="https://code.jquery.com/jquery-3.7.1.min.js"></script>
<script src="canvasjs-commercial-3.8.8/canvasjs.min.js"></script>
—-
Manoj Mohan
Team CanvasJSIt seems like you are loading CanvasJS jQuery plugin instead of jQuery. You can either load jquery from its cdn or from your server by downloading it from this link.
If you are still facing the issue, kindly create sample project reproducing the issue and share it with us over Google-Drive or Onedrive along with sample data so that we can look into your code, run it locally at our end to understand the scenario better and help you out.
—-
Manoj Mohan
Team CanvasJSMarco,
The behavior is designed such that zooming is limited upto a certain region, so the user doesn’t end up zooming into a blank-region (region with no dataPoints). To zoom into a certain region, there should be a minimum of 3-4 dataPoints.
We will reconsider this behavior for future releases.
___________
Manoj Mohan
Team CanvasJSMay 24, 2024 at 5:08 pm in reply to: In scan mode Narrator is incorrectly announcing image on interactive graphs pres #45173As aria-label was set for overlaid canvas instead of the canvas in which charts are drawn, Narrator was announcing it as “Image”. You can add aria-label to canvas and hide the overlaid canvas from the narrator by setting aria-hidden to true as shown in this updated JSFiddle.
—-
Manoj Mohan
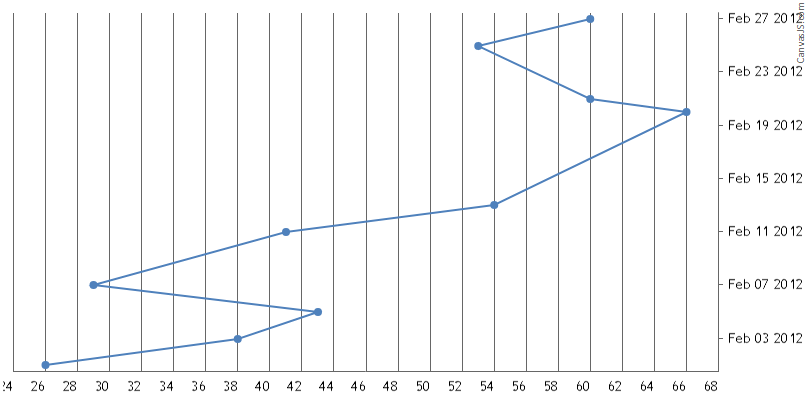
Team CanvasJSMay 23, 2024 at 6:34 pm in reply to: Vertical line charts hover tracking X axis instead of Y when displaying tooltip #45167As of now, the tooltip is shown based on nearest x-values irrespective of y-values. In order to show tooltip based on y-values in a vertical line chart, you can create line chart and rotate it as shown in this JSFiddle.
—-
Manoj Mohan
Team CanvasJSMay 22, 2024 at 6:38 pm in reply to: Axis labels are not rendered with scale breaks, rotated labels and larger font #45160@mm,
[UPDATE]
We have just released v3.12.5 with the above bug fix. Please refer the release blog for more information. Do download the latest version from our download page and let us know your feedback.
Thanks for reporting the use-case. It seems like there is an issue with axis labeling when scalebreak is used along with labelAngle and we will fix it in the future releases. Meanwhile, setting labelMaxWidth seems to fix the issue in this scenario. Please take a look at this updated JSFiddle in which labelMaxWidth is set to 100.
—-
Manoj Mohan
Team CanvasJS-
This reply was modified 1 year, 4 months ago by
Manoj Mohan.
Glad the you were able to figure it out based on your scenario :)
—-
Manoj Mohan
Team CanvasJSGreg,
We tried creating chart with the sample JSON used by you and it seems to be working fine. Please take a look at the screenshot below where date in tooltip is shown as per the JSON data i.e. for 1st Jan 2019, closing value as 130.53.
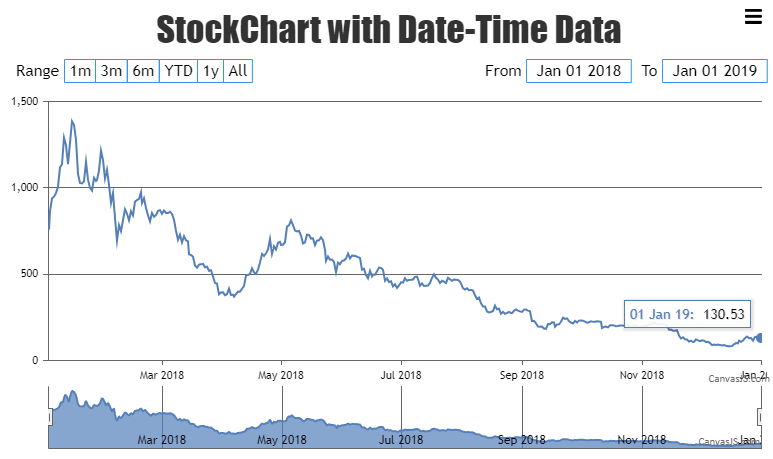
Also, check out this updated JSFiddle for the same.
—-
Manoj Mohan
Team CanvasJS -
This reply was modified 1 year, 4 months ago by