Login to Ask a Question or Reply
You must be logged in to post your query.
Home › Forums › Chart Support › viewPort Max/Min with date value
viewPort Max/Min with date value
- This topic has 8 replies, 3 voices, and was last updated 2 years, 4 months ago by
Manoj Mohan.
Tagged: viewport
-
May 9, 2019 at 10:55 pm #25127
I’m building a ocean tide chart.
I have tides for 14 days on a spline area chart.
The issue is it shows all 14 days at once.I need to be able to set the default view port of the chart to one day, with the users ability to pan/scroll on xAxis (left right) to other days.
May 13, 2019 at 9:57 pm #25159You can programmatically zoom into a region by setting viewportMinimum and viewportMaximum.
To zoom into a certain region, there should be a minimum of 3-4 dataPoints – behavior is designed such that zooming is limited upto a certain region, so the user doesn’t end up zooming into a blank-region (region with no dataPoints). Due to this restriction, it’s not possible to pan chart as you zoom into the region with just 1 dataPoint.
——-
Manoj Mohan
Team CanvasJSMay 14, 2019 at 12:01 am #25165How would you setup a zoom for a date/time value on the xAxis?
May 14, 2019 at 6:37 pm #25172You can set the viewportMinimum as
viewportMinimum: new Date(2019,03,14)and viewportMaximum asviewportMaximum:new Date(2019,04,14)to achieve zooming programmatically over data/time axisX type.——-
Manoj Mohan
Team CanvasJSJanuary 21, 2021 at 6:25 am #32572Hey @manoj-mohan
Can you share a jsfiddle example that
viewportMinimumworks with time?I tried 2 different ways, one is have x value as timestamp, and set xValueType: “dateTime”. like following
  {
  "type": "line",
  "axisX": [
    {
      "viewportMaximum": 1611186373807,
      "viewportMinimum": 1611182782013
    }
  ],

  "data": [
    {
      "markerType": "circle",

      "type": "line",
      "xValueType": "dateTime",


      "dataPoints": [
        {
          "y": 101789,
          "x": 1611185700000,
        },
        {
          "y": 12834,
          "x": 1611186300000,
        }
      ],

    }
  ],

}
But it doesn’t set the range to my desired value. However if I comment out
xValueType: "dateTime", it will work because x value got treated as number.I tried to set x and viewportMinimum to Date object like
viewportMinimum: new Date(2019,03,14), but it still doesn’t work.January 21, 2021 at 8:13 pm #32580June 7, 2021 at 11:06 am #34537We have released CanvasJS Chart v3.2.18 GA with this bug fix, please check out release blog for more information. Please download the latest version from our download page and let us know your feedback.
—
Manoj Mohan
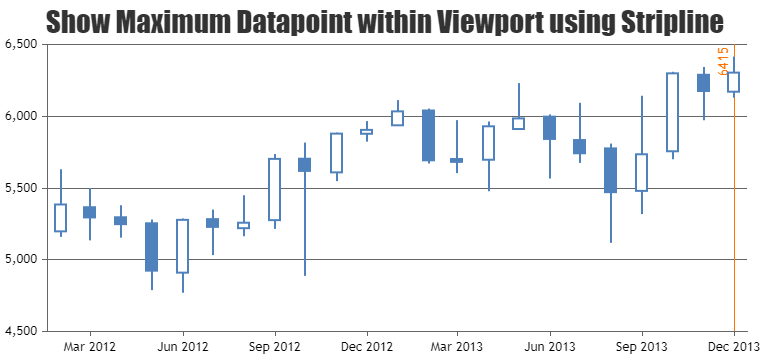
Team CanvasJSMarch 14, 2024 at 2:59 pm #44809I would like to ask if I zoomin, how can I get max value of viewport? Which datapoints in the viewport?
March 14, 2024 at 6:31 pm #44811You can use rangeChanged event to get to know the datapoint with maximum value within viewport on zooming/panning. Please take a look at this JSFiddle for an example on showing maximum datapoint within viewport using stripline.
—-
Manoj Mohan
Team CanvasJS
Tagged: viewport
You must be logged in to reply to this topic.