Home Forums StockChart Support Why dates off by one with tooltips in stock charts?

Why dates off by one with tooltips in stock charts?

Viewing 6 posts - 1 through 6 (of 6 total)
  • #45072

    On the Web site, there is a demo (randomly chosen):

           https://canvasjs.com/javascript-stockcharts/candlestick-stockchart-range-selector/

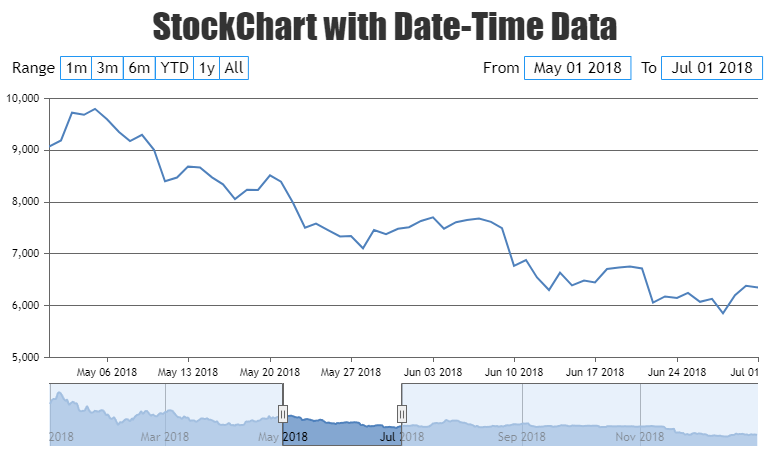
    If you put the tooltip over the last OHLC box on the right hand side, the tooltip box displays:

            30 Jun 18
           Open: $453.29
           High: $455.87
           Low: $444.85
           Close: $451.43

    This is an error.  The JSON file pointed to by the HTML page, on the server, has the following entry for 30 Jun 2018:

          date: “2018-06-30”
          open: 434.6
          high: 462.49
          low: 434.5
          close: 453.29

    This obviously does not correspond to the tooltip.  However, the tooltip does correspond to the following date:

          date: “2018-07-01”
          open: 453.29
          high: 455.87
          low: 444.85
          close: 451.43

    A lot of the demos, and the software I am writing, all have this same problem.
    The date in the tooltip box is off by one day.

    Anyone know what I am doing wrong, or what is wrong with tooltip?

    Thanks

    #45077

    @greg-aharonian,

    JavaScript dates may display an incorrect day when passed in ISO format (YYYY-MM-DD), depending on the user’s time zone. According to MDN, date-only formats are interpreted as UTC time, and date-time formats are interpreted as local time when the time zone offset is absent. To avoid this problem, you can use date-time format or use a different date format along with time-zone. Please take a look at this JSFiddle for an example on the same.

    Stockchart with date-time Data

    Also, refer to this Stack Overflow thread for more information.

    —-
    Manoj Mohan
    Team CanvasJS

    #45078

    The solution offered in the JSFiddle example does not work.

    For the code I have created: http://www.kukaxoco.org/canvas2.html, I am now using the following coding as recommended by the JSFiddle example:

    for(var i = 0; i < data.length; i++){
    dataPoints.push({x: new Date(data[i].date + “T00:00:00”), y: Number(data[i].close)});
    }

    (I also tried hard-wiring the extra text into the JSON file:
    {“date”:”2019-01-01T00:00:00″,”open”:138.78,”high”:138.9,”low”:128.5,”close”:130.53,”volume_eth”:165355.78,”volume_usd”:22097680.63})

    In both cases, the graph displays the correct OHLC for the last day of the file, 2019-01-01, but the tooltip displays as the date: “31 Dec 18”, the trading day before.

    How can this be fixed?

    Greg

    #45079

    Also another oddity:

    My test file: kukaxoco.org/canvas2.html

    opens in Firefox, but not in Safari or Chrome.

    Greg

    #45080

    Also another oddity:

    My test file: kukaxoco.org/canvas2.html

    opens in Firefox, but not in Safari or Chrome.

    Greg

    #45089

    Greg,

    We tried creating chart with the sample JSON used by you and it seems to be working fine. Please take a look at the screenshot below where date in tooltip is shown as per the JSON data i.e. for 1st Jan 2019, closing value as 130.53.

    StockChart with Date-Time Data showing tooltip

    Also, check out this updated JSFiddle for the same.

    —-
    Manoj Mohan
    Team CanvasJS

Viewing 6 posts - 1 through 6 (of 6 total)

You must be logged in to reply to this topic.