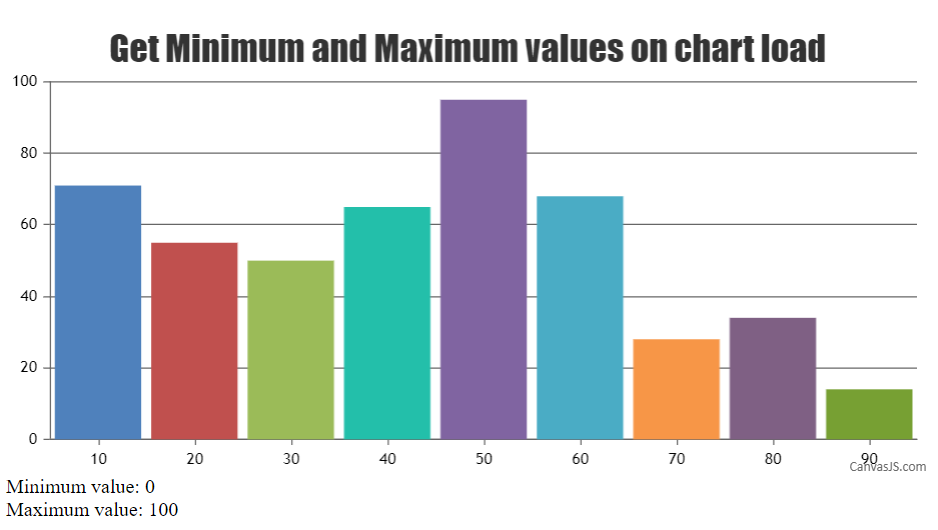
Home Forums Chart Support Get Max y Value

Get Max y Value

Viewing 7 posts - 1 through 7 (of 7 total)
  • #15627

    How can i get Maximum and minimum value of Y after chart(dynamically) loaded. ?

    #15634

    @nikunj,

    You can use get() to fetch the minimum and maximum values of the axisY as shown in the code snippet below –

    var max = chart.axisY[0].get("maximum");
    document.getElementById("displayMaximum").innerHTML = max;
    var min = chart.axisY[0].get("minimum");
    document.getElementById("displayMinimum").innerHTML = min;

    Also, please take a look at this JSFiddle for complete working code.

    Display maximum and minimum value of axisY

    ___________
    Indranil Deo
    Team CanvasJS

    #15635

    Thanks Indra
    Got the answer.

    #15638

    Hello Indra,
    I want to create Range bar chart from range-to-range

    Please check below link and advise me.
    Range Bar Chart

    Thanks in advance
    Regards,
    Nikunj

    #15642

    @nikunj,

    For Range Bar Chart, you can take a look at this documentation page.

    In case you are looking for Stacked Range Bar Chart, we don’t have it out of the box yet. But you can take a look at this work-around to achieve the same using Range Bar Chart.

    Stacked Range Bar chart

    ___________
    Indranil Deo
    Team CanvasJS

    #15680

    Hi Indra,

    How set indexLabel onclick event ?

    Use below example
    Example

    #15686

    nikunj,

    You can use click event handler for adding indexLabel to dataPoint that is clicked. Please check the code snippet below –

    function onClick(e){      
      e.dataPoint.indexLabel = "Y: " + e.dataPoint.y;
      e.chart.render();	   
    } 

    Also, kindly check this JSFiddle for adding indexLabel on clicking specific dataPoint.

    Add indexLabel on dataPoint click

    ___________
    Indranil Deo
    Team CanvasJS

Viewing 7 posts - 1 through 7 (of 7 total)

You must be logged in to reply to this topic.