Login to Ask a Question or Reply
Forum Replies Created by Indranil
-
Yes, CanvasJS works well in flexbox layout.
CanvasJS Chart automatically sets the width and height of the chart according to container’s dimensions. When the container’s dimension is not specified it takes up the default width & height(500px X 400px). Setting 100% width for the Chart-Container will work fine in flexbox layout. Please take a look at this jsfiddle.
If this doesn’t solve the issue, kindly create a jsfiddle with the issue you are facing so that we can understand it better and help you out.
___________
Indranil Deo
Team CanvasJSNested Doughnut Charts are not available as of now. You can consider positioning one chart on top of another as shown in this jsfiddle.
___________
Indranil Deo,
Team CanvasJSJames,
Can you please explain what do you mean by the columns between 4 – 8?
Since each line in your CSV is in the format:
["11/13/2017 00:10:00", "0", "69.8", "1.53", "0", "0.0", "0.0", ""]you can access the columns between 4 & 8 i.e. columns 5, 6, & 7 by accessing the array elements points[4], points[5] & point[6] respectively. But in your CSV data all these columns are zero.Also
x: parseFloat(points[0])won’t work as expected as the first element in the array of your CSV data is a date-time value.Please create a jsfiddle and brief us more about your requirement so that understand you requirement better and help you out.
___________
Indranil Deo,
Team CanvasJSJames,
To get data between line number 4 and 8, you need to start the “for loop” from 5 and run it till 7.
for (var i = 5; i <= 7; i++)___________
Indranil Deo,
Team CanvasJSupdateViewByLen(chart)needs to be called after the data is filtered and the chart is rendered.Please take a look at this updated jsfiddle.
___________
Indranil Deo,
Team CanvasJSNovember 15, 2017 at 11:00 am in reply to: Dynamically build a linear chart from JSON with date? #17578The interval, axisLabel, and gridLines are dependent on dataPoints. Hence till the dataPoints are loaded the mentioned elements cannot be calculated.
However you can display text loader berfore rendering the chart. please take a look at this JSFiddle.

__________
Indranil Deo
Team CanvasJSThanks for reporting. We are looking into it and will get back to you at the earliest.
__________
Indranil Deo,
Team CanvasJSCarl,
You can control the size of the Pie/Doughnut chart by setting the radius property.
___________
Indranil Deo,
Team CanvasJSRyan,
Glad that you figured it out.
Please have a look at stripLines for axisY.
___________
Indranil Deo,
Team CanvasJS-
This reply was modified 8 years, 3 months ago by
Indranil.
Ryan,
This feature is not available out of the box, as of now but, you can take a look at this work-around.
___________
Indranil Deo,
Team CanvasJSCarl,
indexLabels are skipped when there is limited space available for the indexLabels to display or they get too close to other indexLabels (to avoid overlapping) – this behavior is by design.
You can workaround this issue by rotating the Pie Chart using startAngle.
___________
Indranil Deo,
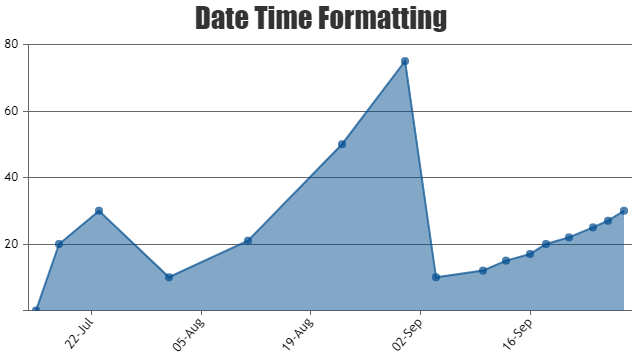
Team CanvasJSNovember 13, 2017 at 11:38 am in reply to: Dynamically build a linear chart from JSON with date? #17531The issue seems to be regarding the formatting of Date and Time. Please refer to this documentation page to format Date and Time.

Also, please refer to this stackoverflow link to parse Unix timestamp to javascript timestamp.
In case you are looking for something else, can you please create jsfiddle with sample JSON data reproducing the issue so that we can understand your requirement better and help you out.
__________
Indranil Deo,
Team CanvasJSAbhi,
CanvasJS is a Commercial Charting Library. You need to purchase a license for Commercial use of CanvasJS.
For evaluation purposes, you can use the Trial Version of CanvasJS, it comes with the canvasjs.min.js.
___________
Indranil Deo,
Team CanvasJSChingju,
Thanks for choosing CanvasJS. Since we have already received your query over email we have replied to you the same.
___________
Indranil Deo,
Team CanvasJS -
This reply was modified 8 years, 3 months ago by