Login to Ask a Question or Reply
Forum Replies Created by Indranil
-
lyma,
Sorry, this feature is not available as of now. Animation happens only in the first render of the chart.
___________
Indranil Deo,
Team CanvasJSYou can add the link to the image using the img option present at the top of the reply section.

___________
Indranil Deo,
Team CanvasJSChris,
Sorry, events for labels are not available as of now.
___________
Indranil Deo,
Team CanvasJSAre you looking for a common x-axis for multiple y-axes? In case you are looking for something else a pictorial representation will help us to understand better.
___________
Indranil Deo,
Team CanvasJSThe error was being thrown as the set method was being used on title without defining it in chart options.
Please take a look at this updated jsfiddle. Also, please take a look at set property for more information.
___________
Indranil Deo,
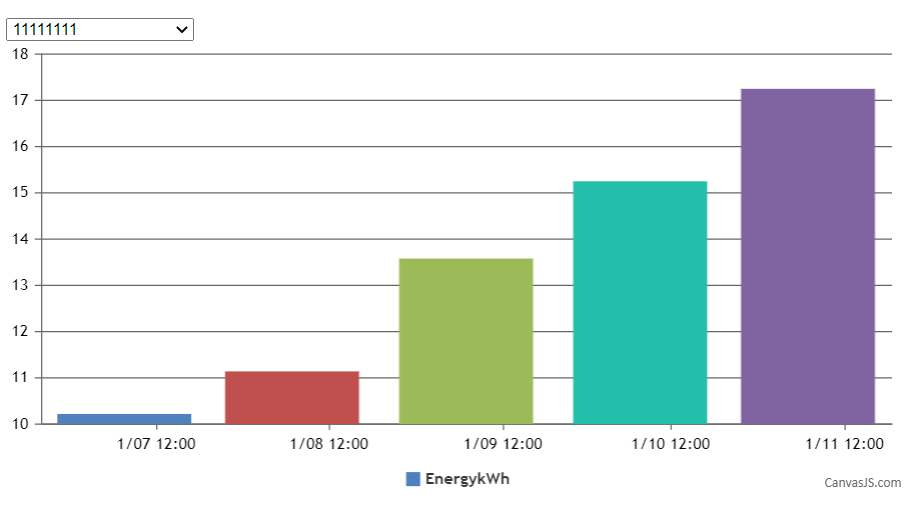
Team CanvasJSBased on your requirement it seems you are trying to render a chart corresponding to the options selected from a dropdown list. If so, please check this JSFiddle example.
You can update the chart options / data based on the options selected from dropdown list as shown below –
$( ".dropdown" ).change(function() {
    chart.options.data[0].dataPoints = [];
    var e = document.getElementById("dd");
    var selected = e.options[e.selectedIndex].value;
    dps = jsonData[selected];
    for(var i in dps) {
      var xVal = dps[i].x;
      chart.options.data[0].dataPoints.push({x: new Date(xVal), y: dps[i].y});
    }
  chart.render();
});
___________
Indranil Deo
Team CanvasJSYou can use title to display the total value. Setting the align property of title to center will display the title at the center of the doughnut.
Please take a look at this jsfiddle.
___________
Indranil Deo,
Team CanvasJSIn case of stacked, pie and doughnut data-series you can use special keywords like
#percent&#total. However, for other chart types, you will have to calculatepercentvalues yourself.Please take a look at toolTip content for more information.
___________
Indranil Deo,
Team CanvasJSYou can work-around this by setting axisY maximum a bit higher than the y-value of the largest dataPoint. Please take a look at this documentation page on axisY.maximum.
___________
Indranil Deo,
Team CanvasJS