Login to Ask a Question or Reply
Forum Replies Created by Indranil
-
You can animate the chart by setting animationEnabled property to true.
Adding an arrow to the given chart is not possible as of now.
___________
Indranil Deo
Team CanvasJSCan you please provide a pictorial representation or a live example of your requirement so that we can understand your scenario better and help you out with an appropriate solution.
___________
Indranil Deo
Team CanvasJSYou can update chart title dynamically with the help of set method. Please refer this documentation page for more information and live example on the same.
___________
Indranil Deo
Team CanvasJSWe are looking into your query and will get back to you at the earliest.
___________
Indranil Deo
Team CanvasJSTrial version is meant for evaluation purposes for 30 days. To upgrade, kindly contact sales@canvasjs.com
___________
Indranil Deo,
Team CanvasJSCanvasJS can render millions of dataPoints. There is no restriction on the number of dataPoints that can be rendered.
___________
Indranil Deo,
Team CanvasJSChart elements like title, label, etc renders the text as the way you pass. Passing text in a reverse-order should work fine. Please take a look at this JSFiddle for an example on RTL. However, placing the legend marker towards the right of the legend text is not possible as of now.
___________
Indranil Deo,
Team CanvasJSCan you please share a pictorial representation for your requirement so that we can understand it better and help you out.
___________
Indranil Deo,
Team CanvasJSAre you looking for something like this? If not can you please share a pictorial representation for your requirement so that we can understand your scenario better and help you out?
__________
Indranil Deo
Team CanvasJSAxis interval is auto calculated and depends on multiple factors like the range of the axis, width of the chart, etc. To have a fixed interval, you can set interval along with intervalType (incase of date-time axis).
__________
Indranil Deo
Team CanvasJSCan you please share a working sample project over google drive/one drive so that we look into it and understand your scenario better.
__________
Indranil Deo
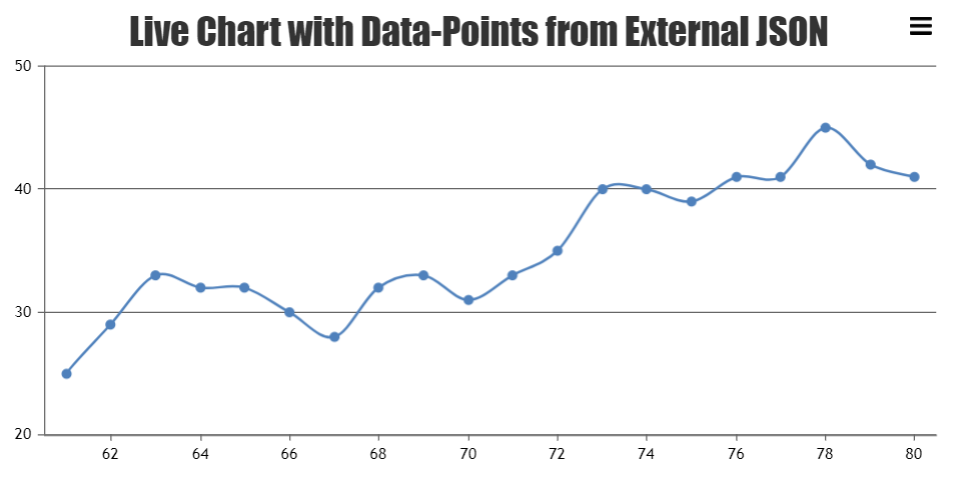
Team CanvasJSTo create a Dynamic chart in Angular you need to first get data from an external source and render the chart as shown below-
let dataPoints = [];
let dpsLength = 0;
let chart = new CanvasJS.Chart("chartContainer",{
  exportEnabled: true,
  title:{
    text:"Live Chart with Data-Points from External JSON"
  },
  data: [{
    type: "spline",
    dataPoints : dataPoints,
  }]
});

$.getJSON("https://canvasjs.com/services/data/datapoints.php?xstart=1&ystart=25&length=20&type=json&callback=?", function(data) {
  $.each(data, function(key, value){
    dataPoints.push({x: value[0], y: parseInt(value[1])});
  });
  dpsLength = dataPoints.length;
  chart.render();
  updateChart();
});
Then call updateChart method for every second. Each time updateChart is called, it gets the data, adds it to dataPoint, and calls chart.render()
function updateChart() {
  $.getJSON("https://canvasjs.com/services/data/datapoints.php?xstart=" + (dpsLength + 1) + "&ystart=" + (dataPoints[dataPoints.length - 1].y) + "&length=1&type=json&callback=?", function(data) {
    $.each(data, function(key, value) {
      dataPoints.push({
        x: parseInt(value[0]),
        y: parseInt(value[1])
      });
      dpsLength++;
    });

    if (dataPoints.length >  20 ) {
      dataPoints.shift();
    }
    chart.render();
    setTimeout(function(){updateChart()}, 1000);
  });
}
Kindly take a look at the “Dynamic Charts” example in the Angular gallery for rendering dynamic chart from an external/Web API in Angular.

___________
Indranil Deo
Team CanvasJS