CanvasJS Chart v3.8.11 & StockChart v1.8.11 GA Released
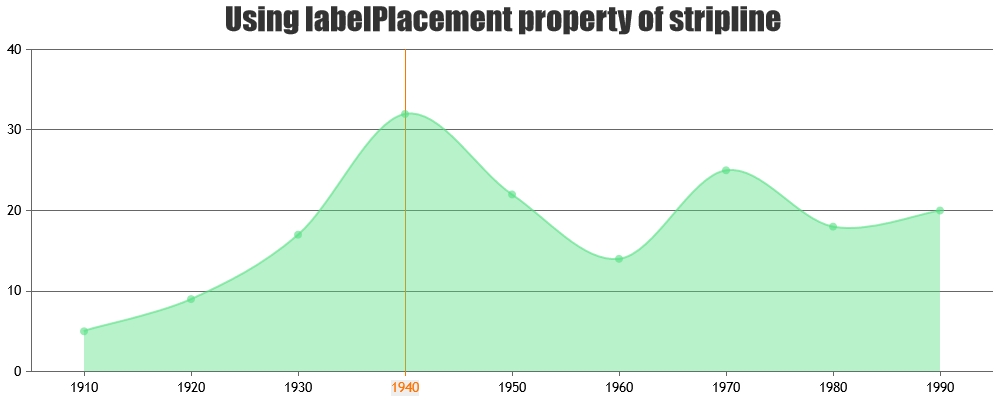
Today we are releasing CanvasJS Chart v3.8.11 & StockChart v1.8.11 GA with a few bug fixes related to axis labels, stripline labels, StockChart height, etc. Below is a summary of this release. Chart Release Update Bug Fixes In some instances, when the labelAngle is positive, the axisY2 labels were not aligning correctly
CanvasJS Chart v3.8.10 & StockChart v1.8.10 GA Released
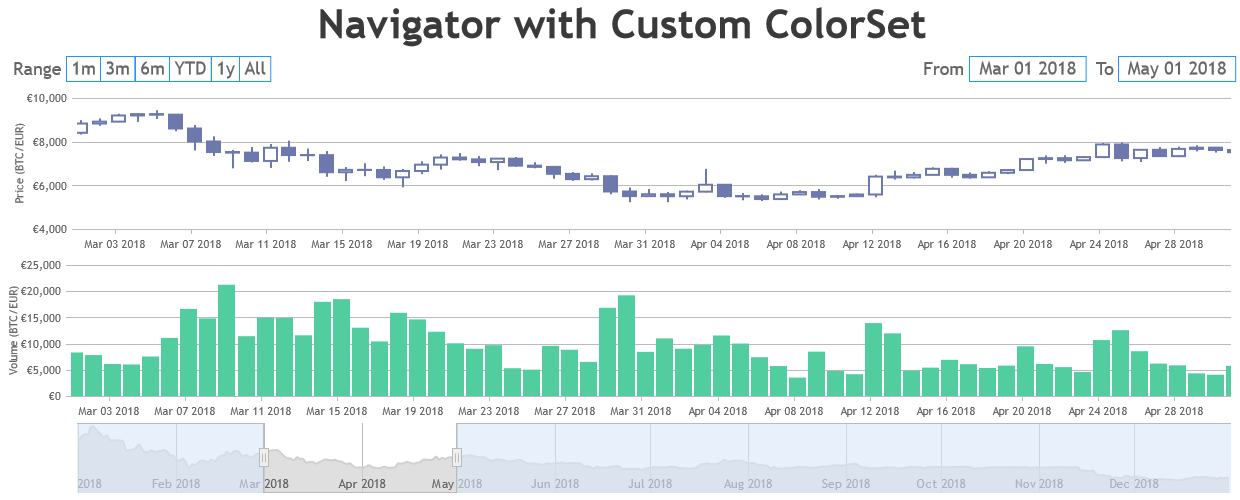
Today we are releasing CanvasJS Chart v3.8.10 & StockChart v1.8.10 GA with a few bug fixes related to colorSet in charts & navigator, buttonStyle & inputFields. Below is a summary of this release. Chart Release Update Bug Fixes colorSet was returning wrong value when theme was set to dark1. StockChart Release
CanvasJS StockChart v1.8.9 GA Released
Today we are releasing CanvasJS StockChart v1.8.9 GA with a few bug fixes related to resetting the range, colorSet of navigator & chart viewport. Below is a summary of this release. Release Update Bug Fixes In some cases, clicking the reset button on individual charts was removing the highlight from the selected
CanvasJS Chart v3.8.8 & StockChart v1.8.8 GA Released
Today we are releasing CanvasJS Chart v3.8.8 & StockChart v1.8.8 GA with a few bug fixes related to legend, startValue, endValue, selectedRangeButtonIndex, etc. Below is a summary of this release. Chart Release Update Bug Fixes Default values of showInLegend & legendText were returned as null when accessed via get method. StockChart
CanvasJS Chart v3.8.7 & StockChart v1.8.7 GA Released
Today we are releasing CanvasJS Chart v3.8.7 & StockChart v1.8.7 GA with a few bug fixes related to tooltip, axisY labels in StockChart, etc. Below is a summary of this release. Chart Release Update Bug Fixes explodeOnClick & valueRepresents were returning null when accessed via get method. In some cases, tooltip was
CanvasJS Chart v3.8.6 & StockChart v1.8.6 GA Released
Today we are releasing CanvasJS Chart v3.8.6 & StockChart v1.8.6 GA with a few bug fixes related to tooltip updated event & StockChart. Below is a summary of this release. Chart Release Update Bug Fixes Tooltip updated event was getting fired even when tooltip was disabled. This was causing issue in some
CanvasJS Chart v3.8.5 & StockChart v1.8.5 GA Released
Today we are releasing CanvasJS Chart v3.8.5 & StockChart v1.8.5 GA with a few bug fixes related to toolbar, navigator & slider. Below is a summary of this release. Chart Release Update Bug Fixes In some cases, toolbar icons (zoom/pan, reset buttons & export menu) seemed to be disappearing on re-rendering the
CanvasJS Chart v3.8.4 & StockChart v1.8.4 GA Released
Today we are releasing CanvasJS Chart v3.8.4 & StockChart v1.8.4 GA with a few bug fixes related to tooltip. Below is a summary of this release. Release Update (Chart & StockChart) Bug Fixes Tooltip styling properties such as backgroundColor, borderColor, etc., were not getting updated upon switching themes after the initial render.
CanvasJS StockChart v1.8.3 GA Released
Today we are releasing CanvasJS StockChart v1.8.3 GA with a few bug fixes related to slider, axis labels & chart background. Below is a summary of this release. Release Update Bug Fixes backgroundColor of individual charts was not getting updated after initial rendering. In certain scenarios, the height of the navigator was
CanvasJS Chart v3.8.2 & StockChart v1.8.2 GA Released
Today we are releasing CanvasJS Chart v3.8.2 & StockChart v1.8.2 GA with a few bug fixes related to tooltip, crosshair & chart height. Below is a summary of this release. Chart Release Update Bug Fixes In some cases, error was being thrown when attempting to update the tooltip for a dynamically added
