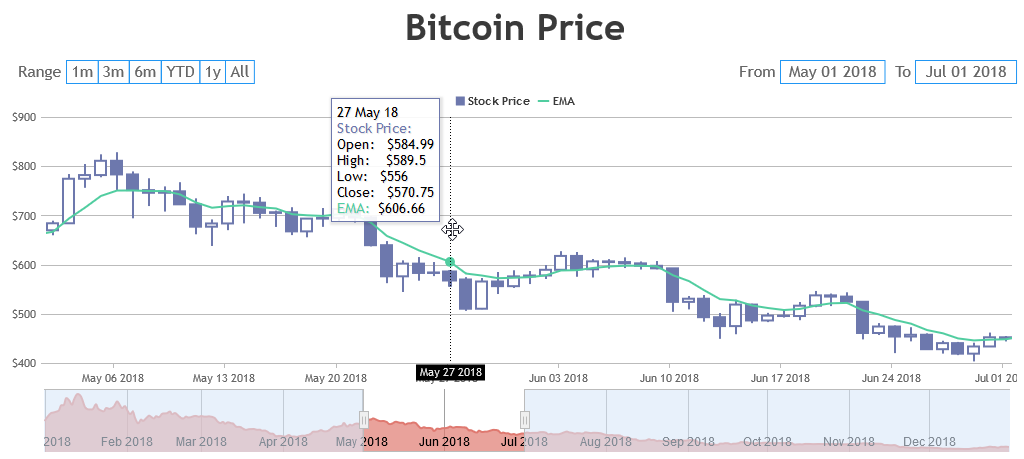
Today we are releasing Chart v3.0 Beta 2 & StockChart v1.0 Beta 2 with few bug fixes. Below is a summary of this release.

Bug Fixes:
- In few cases of bar chart, axisY title used to overlap with axisY labels.
- In few cases, X-axis crosshair label was not sticking to axis-line.
These bug-fixes are applied to both Chart & StockChart.
Do download the latest version from our download page and let us know your feedback.
Thank You,
Vishwas R
Team CanvasJS
Comment
As an enthusiastic user of CanvasJS for candlestick charts, I’ve been watching the progress of StockCharts keenly. What I’d really like to see is a feature allowing easy order creation, fully customisable: JS Events for double clicks on a bar, single click on a bar at a certain point (OHLC), and easier manipulation of striplines. I have created something similar on Chart but it’s clumsy and buggy. For example:
1a) Double click on any bar adds a stripline at high and low of that bar, with light grey shading in between
1b) Single click on a bar adds a stripline to its closest OHLC value. Second click on another bar does the same, and the area between the two lines is shaded light grey
2) Each strip line has a small toolbar attached to it to allow value rounding, and minor or major incrementing/decrementing, or dragging
3) A third stripline is plotted to show a target, assuming the other two lines are entry and stop loss, and target is calculated on a win/loss ratio
4) A buy/Sell toggle allows me to flip the entry and stop lines, and the target adjusted accordingly
I have also created a broker specific order placement based on the values the striplines are at.
More than happy to discuss this or give a demo of what I have should you be interested.