Vue.js Line Charts
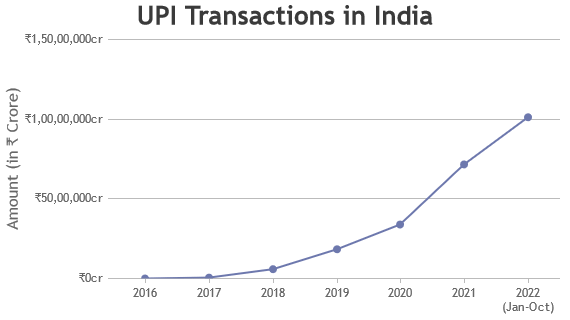
Vuejs line chart / plot connects series of points by a line segment. Line Graph is frequently used to show trends & analyze how the data has changed over time. Vuejs chart component supports multiple variants of line charts like Line Chart, Spline Chart & Step-Line Chart. You can easily switch between them just by changing the type property.
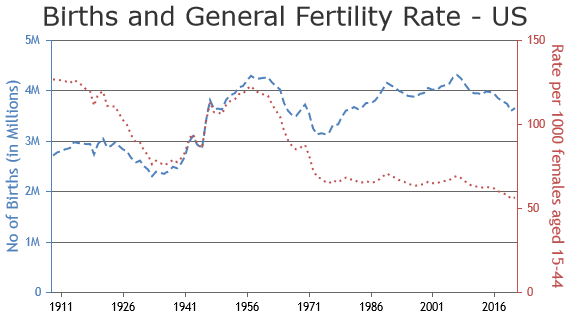
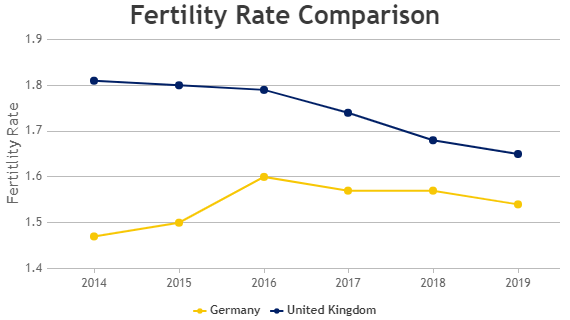
Multiple dataseries can also be plotted in a chart to compare the trend between them & they are called multi-series line charts. In case of multi-series line chart, line color, thickness & dash-type can be set in order to distinguish between them. Also, you can enable legends to display the dataseries name.
Vue.js Line Charts
Line Charts & Graphs are drawn by connecting datapoints by a straight line segment.
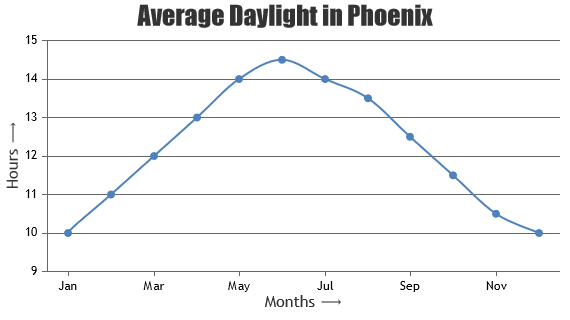
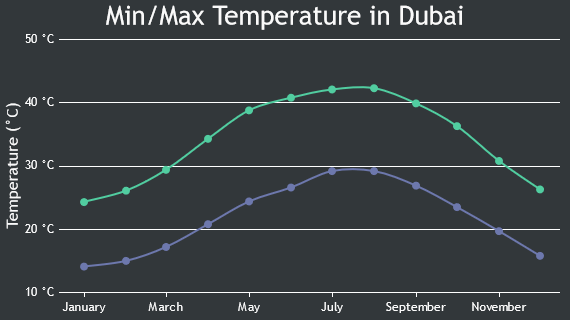
Vue.js Spline Charts
Spline Charts connects datapoints with a smooth curve & hence also referred to as Smooth Curved Line Chart.
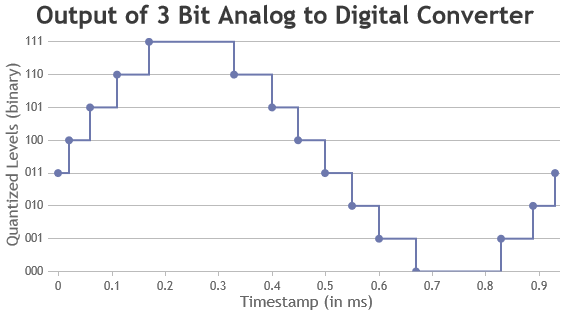
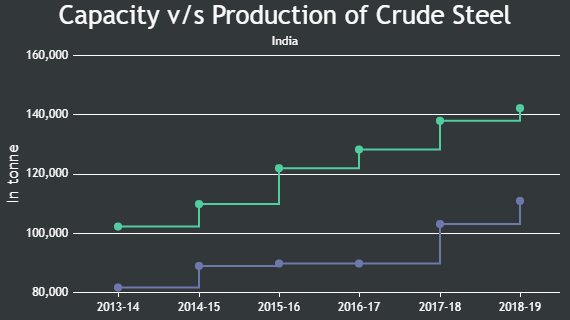
Vue.js Step Line Charts
Step Line Charts form a staircase like shape & hence also referred to as staircase charts.
Features used Commonly in Vue.js Line Chart
Most commonly used features in Vuejs Line Chart includes markers, line customization, zooming, panning, etc.
- Marker type can be changed by setting markerType property.
- Size of the marker can be changed by setting markerSize property.
- Dash type of line can be changed to either solid or dashed or dotted by setting lineDashType property.
- Thickness & color of line can be changed by setting lineThickness & color properties.
- Zooming / Panning can be enabled by setting zoomEnabled property to true.
How to Improve Performance of Vue.js Line Chart?
In most of the cases, 100,000+ datapoints can render fast enough with default options of CanvasJS. However, if you are rendering very large number of datapoints, there are few tweaks that you can do in order to make the chart perform better.
- Disable markers when there are large number of data. Showing makers with large dataset will make it look cluttered & makes chart slow.
- If you are using dynamic charts, don’t recreate chart each time you add new datapoint. Instead, update datapoints array & call chart.render() as shown here.
Vue.js Line Chart Types
General Tips for Vue.js Line Charts
- Use multiple axes when two dataseries have different units / scale ranges.
- It is recommended to sort datapoints in ascending order of x values.
- When you have more than 4 series, allow users to hide/unhide any series by clicking the legend
- Having too many series in a chart makes it look cluttered. Experts suggest to have not more than 4 series in a chart.
