Vue.js Funnel Charts & Pyramid Charts
Vuejs Funnel Charts are used to represent data in different stages of a process like interview, sales process, etc. Funnel Chart highlights successful strategies and identifies potential problem areas while passing through different stages.
Vuejs Pyramid Charts are inverted funnels with no neck. Pyramid Charts are sometimes referred to as Triangular Charts. Funnel & Pyramid Charts are often used to illustrate stages within a process that are linear, connected and sequential.
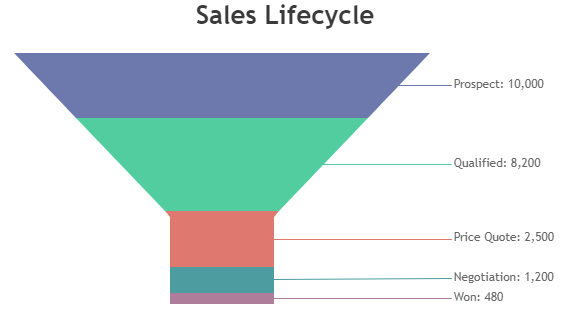
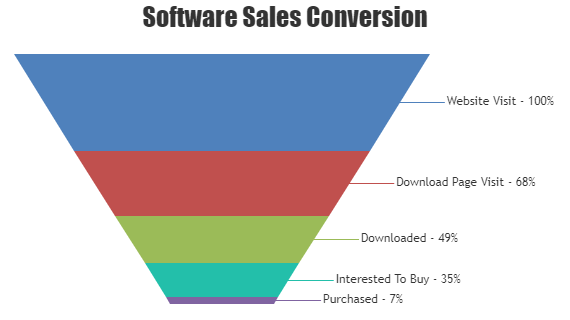
Vue.js Funnel Charts
Funnel charts are used to show values across multiple stages in a process.
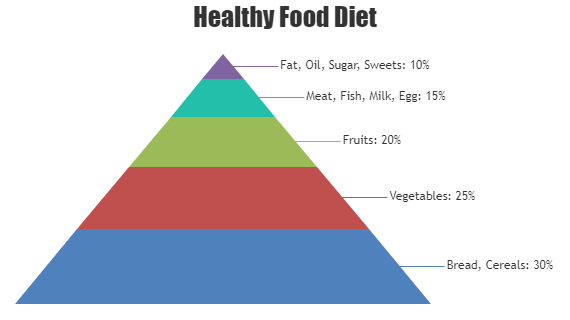
Vue.js Pyramid Charts
Pyramid Charts are also referred to as triangular charts.
Features used Commonly in Vue.js Funnel & Pyramid Charts
Most commonly used features in Vuejs Funnel & Pyramid Charts include customizing width & height of neck, value-represents, exploding sections, etc.
- Neck width & height can be controlled by setting neckWidth & neckHeight properties.
- valueRepresents property allows you to specify whether values in Funnel / Pyramid Charts are proportional to respective section’s height or area.
- Section of the Funnel / Pyramid chart can be exploded on initial render by setting exploded property.
Vue.js Funnel & Pyramid Chart Types
General Tips for Vue.js Funnel & Pyramid Charts
- Include atleast 3 stages. When there are only two stages in a process, we only have a single ratio to comprehend. It’s better to use pie chart in such scenarios.