• Demos
    • JavaScript Charts
    • JavaScript StockCharts
  • Download/NPM
    • Download CanvasJS
    • Install via NPM
  • Integrations
    Front End Technology Samples
    • React Charts
    • Angular Charts
    • Vue.js Charts New!
    • jQuery Charts
    • Dashboards
    Server Side Technology Samples
    • PHP Charts
    • Python Charts New!
    • ASP.NET MVC Charts
    • Spring MVC Charts
    • JSP Charts
  • License
  • Blog
  • Docs
    • Chart Documentation
    • StockChart Documentation
  • Support Forum
    • Chart Support
    • StockChart Support
  • My Account
My Account
  • KEY FEATURES
    • Basic Chart
    • Chart with Animation
    • Chart with Zooming/Panning
    • Multi Series Chart
    • Chart with Multiple Axes
    • Chart with Logarithmic Axis
    • Chart with JSON Data
    • Dynamic Chart
    • Drilldown Chart
    • Responsive Chart
    • Synchronized Charts
  • LINE CHARTS
    • Line Chart
    • Dashed Line Chart
    • Multi Series Line Chart
    • Spline Chart
    • Multi Series Spline Chart
    • Step Line Chart
    • Multi Series Step Line Chart
  • BAR CHARTS
    • Bar Chart with Category Axis
    • Multi Series Bar Chart
    • Stacked Bar Chart
    • Stacked Bar 100% Chart
  • COLUMN CHARTS
    • Column Chart with Category Axis
    • Column Chart in Dark Theme
    • Multi Series Column Chart
    • Stacked Column Chart
    • Stacked Column 100% Chart
    • Stacked Column 100% Chart with IndexLabel
  • PIE & DOUGHNUT CHARTS
    • Pie Chart
    • Doughnut Chart
    • Doughnut Chart in Dark Theme
  • AREA CHARTS
    • Area Chart with Category Axis
    • Multi Series Area Chart
    • Spline Area Chart
    • Multi Series Spline Area Chart
    • Step Area Chart
    • Stacked Area Chart
    • Stacked Area 100% Chart
  • RANGE CHARTS
    • Range Column Chart
    • Multi Series Range Column Chart
    • Range Bar Chart
    • Multi Series Range Bar Chart
    • Range Area Chart
    • Multi Series Range Area Chart
    • Range Spline Area Chart
    • Multi Series Range Spline Area Chart
  • BUBBLE & SCATTER CHARTS
    • Bubble Chart with 3-Dimensional Data
    • Bubble Chart in Dark Theme
    • Scatter Chart
  • FUNNEL & PYRAMID CHARTS
    • Funnel Chart with Index Labels
    • Funnel Chart with Custom Neck Length
    • Pyramid Chart
  • FINANCIAL CHARTS
    • Candlestick Chart
    • Multi Series Candlestick Chart
    • OHLC Chart
    • OHLC Chart from JSON Data
    • Box & Whisker Chart
    • Waterfall Chart
  • COMBINATION CHARTS
    • Pareto Chart
    • Error Line Chart
    • Combination of Range Area & Line Chart
    • Combination of Candlestick & Line chart
  • DYNAMIC CHARTS
    • Dynamic Line Chart
    • Dynamic Column Chart
    • Dynamic Multi Series Chart
  • STOCKCHARTS
    • StockChart with Numeric Axis
    • StockChart with Date-Time Axis
    • StockChart with Navigator & Range Selector
  • JAVASCRIPT, JQUERY, REACT, ANGULAR
    • JavaScript Charts
    • jQuery Charts
    • React Charts
    • Angular Charts
  • SERVER SIDE TECHNOLOGIES
    • ASP.NET MVC Charts
    • JSP Charts
    • PHP Charts
    • Python Charts
    • Spring MVC Charts

Vue.js Financial Charts & Advanced Charts

Download Vue.js Chart Samples
  • Vue.js Chart Samples
  • JavaScript Chart Samples
  • React Chart Samples
  • Angular Chart Samples
  • jQuery Chart Samples
  • PHP Chart Samples
  • Python Django Chart Samples
  • ASP.NET Chart Samples
  • JSP Chart Samples
  • Spring MVC Chart Samples
  • Dashboard Samples
  • JavaScript StockChart Samples

Vuejs Financial are used to monitor various performance metrics in areas such as expenses, budgets, cash flow, etc. Financial charts include Candlestick & OHLC charts.

CanvasJS also supports advanced charts like Box & Whisker, Waterfall Charts

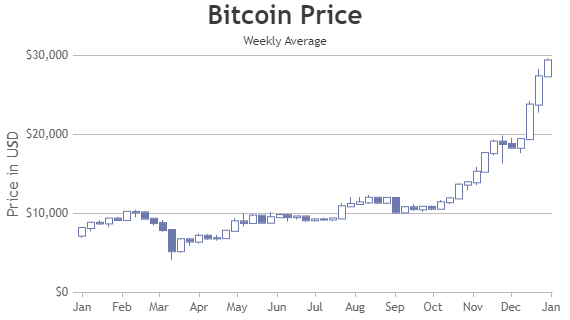
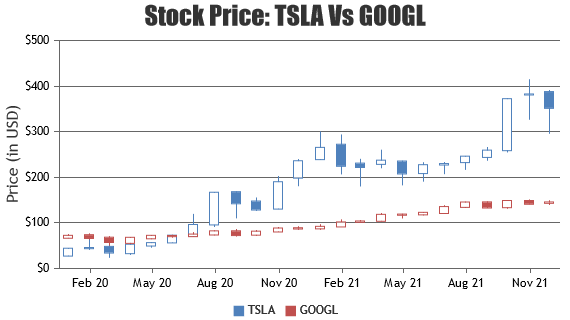
Vue.js Candlestick Charts

Candlestick Chart forms a column with vertical lines representing open, high, low and close values of a data point.
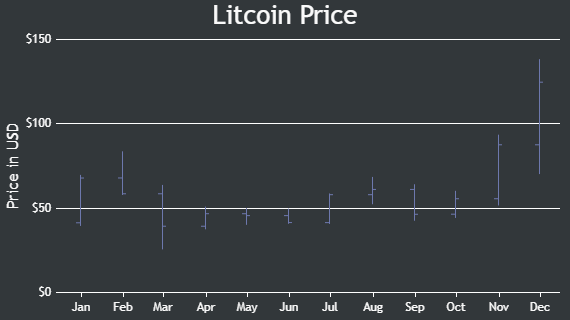
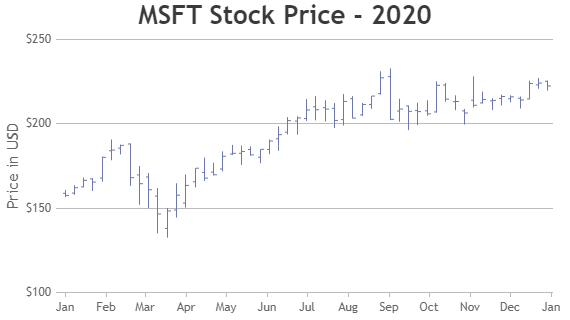
Vue.js Candlestick Chart
Candlestick Chart
Vue.js Multi Series Candlestick Chart
Multi Series Candlestick Chart

Vue.js OHLC Charts

OHLC Charts are used to shows open, high, low, and closing prices for each period.

Vue.js OHLC Chart
OHLC Chart
Vue.js OHLC Chart with JSON Data
OHLC Chart with JSON Data

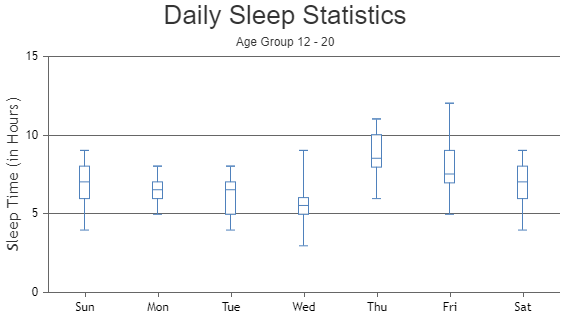
Vue.js Box & Whisker Charts

Box and Whisker Charts, also known as Box Plots are used to show the distribution of numerical data through their quartiles, highlighting the median / mean values.

Vue.js Box & Whisker Chart
Box & Whisker Chart

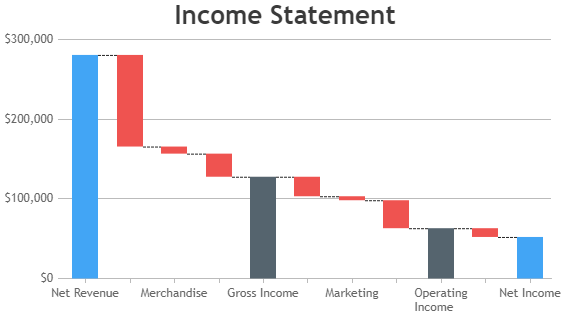
Vue.js Waterfall Charts

Waterfall chart is used to visualize financial statements, analyze sales or product value over a period of time.

Vue.js Waterfall Chart
Waterfall Chart

Features used Commonly in Vue.js Financial & Advanced Charts

Most commonly used features in Vuejs Financial & Advanced Charts include customizing rising & falling colors, customizing whiskers, etc.

  • Rising color & falling color can be changed by setting risingColor & fallingColor properties.
  • You can set the color for the upper box and the lower box using upperBoxColor and lowerBoxColor.

Vue.js Financial & Advanced Chart Types

  • Vue.js Candlestick Chart
  • Vue.js OHLC Chart
  • Vue.js Box & Whisker Chart
  • Vue.js Waterfall Chart

General Tips for Vue.js Financial & Advanced Charts

  • Use risingColor & fallingColor to showcase rise & fall in value.
  • You can use Line Chart or Column Chart along with Financial Charts to show technical indicators

Quick Links

  • Chart Docs
  • StockChart Docs
  • About Us
  • FAQs

Server Side Technologies

  • ASP.NET MVC Charts
  • PHP Charts
  • JSP Charts
  • Spring MVC Charts

Front Side Technologies

  • JavaScript Charts
  • jQuery Charts
  • React Charts
  • Angular Charts
  • JavaScript StockCharts

Contact

  • Fenopix, Inc.
  • 2093 Philadelphia Pike,
  • #5678, Claymont,
  • Delaware 19703
  • United States Of America

©2025 Fenopix Privacy Policy Cookies Policy Careers