• Demos
    • JavaScript Charts
    • JavaScript StockCharts
  • Download/NPM
    • Download CanvasJS
    • Install via NPM
  • Integrations
    Front End Technology Samples
    • React Charts
    • Angular Charts
    • Vue.js Charts New!
    • jQuery Charts
    • Dashboards
    Server Side Technology Samples
    • PHP Charts
    • Python Charts New!
    • ASP.NET MVC Charts
    • Spring MVC Charts
    • JSP Charts
  • License
  • Blog
  • Docs
    • Chart Documentation
    • StockChart Documentation
  • Support Forum
    • Chart Support
    • StockChart Support
  • My Account
My Account
  • KEY FEATURES
    • Chart with Index / Data Label
    • Chart with Zooming / Panning
    • Chart using JSON Data
    • Chart with Animation
    • Multi Series Chart
    • Chart with Multiple Axes
    • Chart with Crosshair
    • Chart with Scale Breaks
    • Chart with Logarithmic Axis
    • Performance with 50,000 Data Points
    • Responsive Charts
    • Chart with Drilldown
  • LINE CHARTS
    • Line Chart with Formatted Axes Labels
    • Dashed Line Chart
    • Multi Series Line Chart
    • Spline Chart
    • Multi Series Spline Chart
    • Step Line Chart
    • Multi Series Step Line Chart
  • BAR CHARTS
    • Bar Chart with Category Axis
    • Multi Series Bar Chart
    • Stacked Bar Chart
    • Stacked Bar 100% Chart
    • Stacked Bar 100% Chart with Indexlabel
  • COLUMN CHARTS
    • Column Chart with Category Axis
    • Multi Series Column Chart
    • Stacked Column Chart
    • Stacked Column 100% Chart
    • Stacked Column 100% Chart with Indexlabel
    • Waterfall Chart
    • Waterfall Chart with Indexlabel
  • AREA CHARTS
    • Area Chart with Date-Time Axis
    • Multi Series Area Chart
    • Spline Area Chart
    • Multi Series Spline Area Chart
    • Step Area Chart
    • Stacked Area Chart
    • Stacked Area 100% Chart
  • RANGE CHARTS
    • Range Column Chart
    • Multi Series Range Column Chart
    • Range Bar Chart
    • Multi Series Range Bar Chart
    • Range Area Chart
    • Multi Series Range Area Chart
    • Range Spline Area Chart
    • Multi Series Range Spline Area Chart
  • PIE & DOUGHNUT CHARTS
    • Pie Chart with Indexlabels
    • Pie Chart with Index Labels Placed Inside
    • Doughnut Chart
    • Doughnut Chart in Dark Theme
  • FUNNEL & PYRAMID CHARTS
    • Funnel Chart
    • Funnel Chart with Custom Neck
    • Pyramid Chart
  • FINANCIAL CHARTS
    • Candlestick Chart
    • Candlestick Chart from JSON
    • OHLC Chart
    • OHLC with Trendline
    • Box and Whisker Chart
    • Box and Whisker Chart with Customization
  • BUBBLE & SCATTER CHARTS
    • Scatter Chart
    • Scatter Chart with Custom Markers
    • Bubble Chart
  • COMBINATION CHARTS
    • Error chart
    • Error Line Chart
    • Pareto Chart
    • Combination of Column, Line and Area Chart
  • DYNAMIC CHARTS
    • Dynamic Line Chart
    • Dynamic Column Chart
    • Dynamic Multi Series Chart
  • STOCKCHARTS
    • StockChart with Numeric Axis
    • StockChart with Date-Time Axis
    • StockChart with SplineArea & Range Selector
  • ANGULAR, VUE.JS, JAVASCRIPT, JQUERY
    • Angular Charts
    • Vue.js Charts
    • jQuery Charts
    • JavaScript Charts
  • SERVER SIDE TECHNOLOGIES
    • ASP.NET MVC Charts
    • PHP Charts
    • Python Charts
    • JSP Charts
    • Spring MVC Charts

React Combination Charts & Graphs

Download React Chart Samples
  • React Chart Samples
  • JavaScript Chart Samples
  • Angular Chart Samples
  • Vue.js Chart Samples
  • jQuery Chart Samples
  • PHP Chart Samples
  • Python Django Chart Samples
  • ASP.NET Chart Samples
  • JSP Chart Samples
  • Spring MVC Chart Samples
  • Dashboard Samples
  • JavaScript StockChart Samples

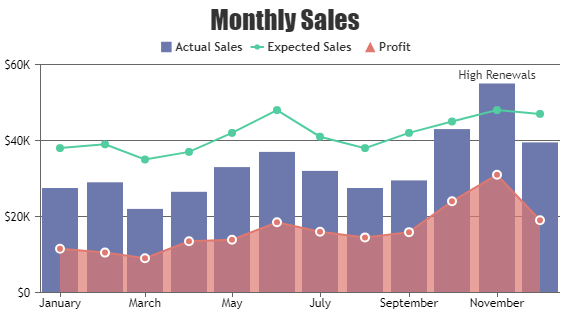
React Combination Charts, also known as Combo or Mixed Charts, allow you to combine different chart types like line, column, area, range, ohlc, candlestick, and more into a single chart. For example, to display both the total sales and sales trend over time in single chart. 
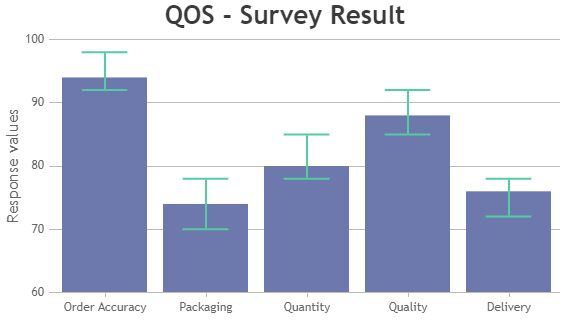
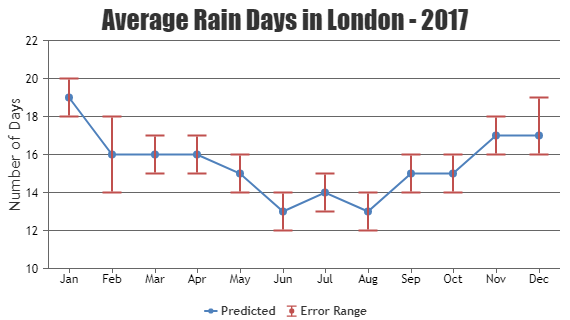
Combination of candlestick chart with line or column chart as technical indicators is commonly used for visualizing financial chart. Also, Range and Line Charts are commonly used together to display data ranges (high and low values) alongside average values. For instance, in quality control for monitoring of products, upper and lower limit of tolerance measurement can be drawn with Range Area Chart while line chart depicting the ideal measurement value.

React Combination Charts

Combination Charts (Combo / Mixed Charts) are formed by combining multiple chart types in one chart.

React Error Chart
Error Chart
React Error Line Chart
Error Line Chart
React Pareto Chart
Pareto Chart
Combination of React Column, Line and Area Chart
Combination of Column, Line and Area Chart

Features used Commonly in React Combination Charts

  • Shared ToolTip: Instead of having separate tooltip for each data series, combine all the relevant information across data series into one tooltip by setting shared property of tooltip to true.
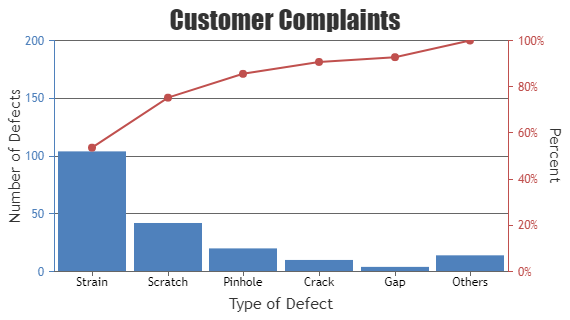
  • Multiple Y-Axis: Combination charts with multiple axes allow you to display multiple data series that have different units or range of values on the same chart. This is useful when comparing data sets that are related but measured differently, as it ensures each series is clearly visible and comprehensible.
  • Hide/UnHide DataSeries: Hiding and Unhiding dataseries on clicking legend allow to focus on specific data series or compare different subsets of data without cluttering the chart.

General Tips for React Combination Charts

  • Indicators in Financial Chart: Line Chart can be used for most of the technical indicators in Financial/Stock Chart.
  • Rendering Order: When combining an area chart with any other chart type, prioritize rendering the area chart first, followed by the other chart types. Otherwise, area chart could hide other chart type.
  • Use Opacity: In combination charts, consider using opacity to make sure that overlapping series don’t hide each other.

Quick Links

  • Chart Docs
  • StockChart Docs
  • About Us
  • FAQs

Server Side Technologies

  • ASP.NET MVC Charts
  • PHP Charts
  • JSP Charts
  • Spring MVC Charts

Front Side Technologies

  • JavaScript Charts
  • jQuery Charts
  • React Charts
  • Angular Charts
  • JavaScript StockCharts

Contact

  • Fenopix, Inc.
  • 2093 Philadelphia Pike,
  • #5678, Claymont,
  • Delaware 19703
  • United States Of America

©2025 Fenopix Privacy Policy Cookies Policy Careers