Login to Ask a Question or Reply
Forum Replies Created by Vishwas R
-
Michela,
You can achieve this either by position transparent stripLines with label in-between columns as shown in this jsfiddle or by adding a scatter dataSeries to the chart as shown in this jsfiddle.
—
Vishwas R
Team CanvasJSPragyan,
width and height properties of the chart should be numeric. In the JSFiddle that you have shared, the values passed seems to be incorrect. Passing numeric values seems to be working fine in this case. Please take a look at this updated jsfiddle for working code.
—
Vishwas R
Team CanvasJSPragyan,
By default Chart takes the size of its container (if set). So you can just set the width and height of the container in which you are going to place the chart as shown below:
<div id="chartContainer" style="height: 300px; width: 500px;">Else you can also set the same using “width” and “height” property in chart options.
var chart = new CanvasJS.Chart(“chartContainer”, {
    width:600,//in pixels
    height:800,//in pixels
    title: {
        text: ” Chart Title “,
    }
    ...
    ...
}
If this doesn’t solve your issue, kindly create jsfiddle reproducing the issue you are facing so that we can look into your code and help you better?
—
Vishwas R
Team CanvasJSApril 10, 2017 at 9:52 am in reply to: How to make y-axis centered rather staying in the left #14816You can use rangeChanged event of chart1 to programmatically zoom axis of chart2. Please check this updated jsfiddle.
You can also refer tutorial on Sync Zooming and Panning across Multiple Charts.
—
Vishwas R
Team CanvasJSApril 10, 2017 at 9:13 am in reply to: How can I plot my values from my local storage using JSON Objects? #14815Cristian,
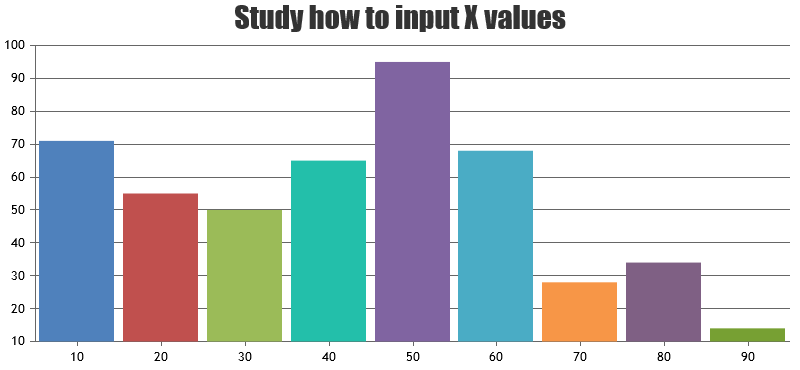
1) By setting dataPointWidth based on axis width and number of dataPoints in column chart, histogram chart can be rendered. Please check this JSFiddle.
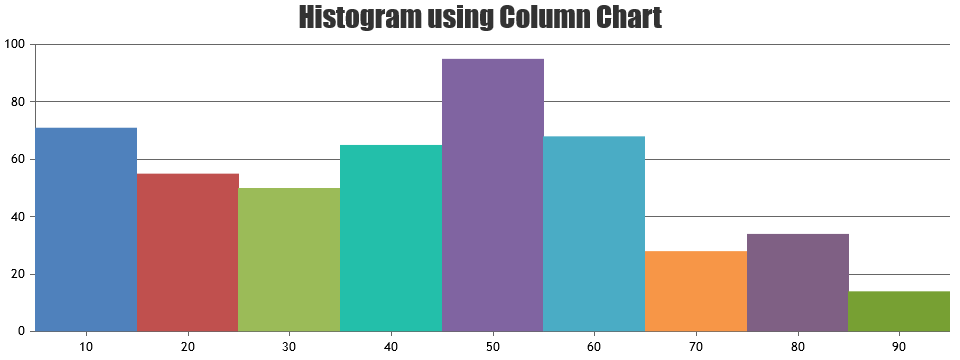
2) You can remove left/right padding between column and axis by setting minimum/maximum.
—
Vishwas R
Team CanvasJSMarch 23, 2017 at 10:00 am in reply to: Mozilla Firefox Line Chart with DateTime Rendering Issue #14653We observe that x-values are not valid JavaScript date-time objects in your code and the jsfiddle you have shared is not working even in Google Chrome(v56.0.2924) or IE (v11.0.10240).
Chrome:

IE:

Please refer this link for valid JavaScript date-time formats. Changing it to valid format will work fine across all browsers. Also refer date-time axis for more info.
—
Vishwas R
Team CanvasJSMarch 21, 2017 at 5:39 pm in reply to: Mozilla Firefox Line Chart with DateTime Rendering Issue #14637Can you kindly create a jsfiddle that reproduces the issue, so that we can look into it and help you out.
—
Vishwas R
Team CanvasJSLawrence,
Sorry this feature is not available as of now.
—
Vishwas R
Team CanvasJSDaniel Silva,
We have just released v1.9.8 with this bug fix. Please refer to the release blog for more information.
—
Vishwas R
Team CanvasJSMarch 17, 2017 at 5:59 pm in reply to: Animation for Secondary Axis is Originating from Outside #14605Dinesh,
We have just released v1.9.8 with this bug fix. Please refer to the release blog for more information.
—
Vishwas R
Team CanvasJSWe have just released v1.9.8 with this bug fix. Please refer to the release blog for more information.
—
Vishwas R
Team CanvasJSWe have just released v1.9.8 with this bug fix. Please refer to the release blog for more information.
—
Vishwas R
Team CanvasJSdataPoints should be an array, but we observe that you are passing string instead of array. Please check this updated jsfiddle.
—
Vishwas R
Team CanvasJS