Login to Ask a Question or Reply
Forum Replies Created by Vishwas R
-
Meraj Ahmed,
You can achieve this by finding the last visible dataSeries in the chart and adding indexLabels to it. Please take a look at this jsfiddle.
—
Vishwas R
Team CanvasJSMarch 6, 2018 at 3:40 pm in reply to: Improve the vertical bar performance with a hover canvas? #19843Since we are already in the middle of our current plans, it might not be possible to consider these behavioral changes immediately. However we will revisit the behavioral changes in future releases and we will consider your suggestions at that point of time.
—
Vishwas R
Team CanvasJSMarch 4, 2018 at 4:18 pm in reply to: Improve the vertical bar performance with a hover canvas? #19823Thanks for the suggestion. I will discuss this behavior with the team and reconsider for future releases.
—
Vishwas R
Team CanvasJSYou can use labelFormatter to hide axis-labels. You can use tickLength and lineThickness to hide tick and axis-lines respectively. Below is the code-snippet.
axisX:{
    gridThickness: 0,
    tickLength: 0,
    lineThickness: 0,
    labelFormatter: function(){
      return " ";
    }
  },
  axisY:{
    gridThickness: 0,
    tickLength: 0,
    lineThickness: 0,
    labelFormatter: function(){
      return " ";
    }
  },
Please take a look at this JSFiddle for complete code.
—
Vishwas R
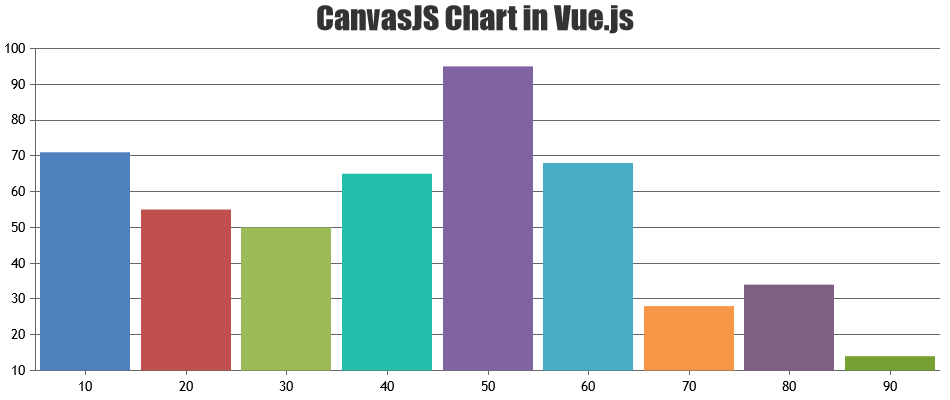
Team CanvasJSCanvasJS Charts & StockChart can be easily integrated with Webpack & React, Angular, Vue.js, etc. Please take a look at this JSFiddle for an example on integrating CanvasJS Chart in VueJS.
 .
.
We don’t have a ready sample for Webpack with VueJS, but we will work on it and get back to you at the earliest. Meantime please take a look at this sample project for CanvasJS Charts with React & Webpack.—
Vishwas R
Team CanvasJSSorry, as of now html tags are not supported except in toolTip, take a look at toolTipContent for the same. It’s there in our features wishlist, but there is no definite timeline.
—
Vishwas R
Team CanvasJSHTML tags are not supported in labels as of now. Instead, you can use labelMaxWidth property of axisX/axisY to wrap the label once the label-width reaches the specified max-width.
Please take a look at this jsfiddle.
—
Vishwas R
Team CanvasJSYou can apply customBreaks with spacing set to 0 as shown in this jsfiddle.
—
Vishwas R
Team CanvasJSYou can use axis scale-breaks to remove the empty space. Also you can set spacing to 0, so that it looks continuous.
—
Vishwas R
Team CanvasJSFebruary 27, 2018 at 5:08 pm in reply to: A webpage is slowing down your browser – Firefox Hang – Specific Date #19777We are unable to find any issue when the chart related code is executed separately either in jsfiddle or in html file. Can you kindly check the plugins that are being used in your application, which may be causing the issue?
—
Vishwas R
Team CanvasJSFebruary 26, 2018 at 9:58 am in reply to: A webpage is slowing down your browser – Firefox Hang – Specific Date #19757The code you have shared seems to be working fine across all browsers including Firefox across different platforms.
Can you kindly share the code either as html file (either over Google-Drive or Onedrive) or create jsfiddle reproducing the issue so that we can understand your scenario better and help you out?—
Vishwas R
Team CanvasJSWojciech,
Zoom Out in steps is not available as of now. But by storing every zoom-steps on rangeChanged and updating the viewport-range based on zoom-steps on click of back-button (an extra button added) you can achieve the same. Please take a look at this jsfiddle.
—
Vishwas R
Team CanvasJS
