Login to Ask a Question or Reply
Forum Replies Created by Vishwas R
-
Yes, as there are only 2 dataPoints attached to secondary y-axis, it invalidates the zooming region over y-axis.
—
Vishwas R
Team CanvasJSPlease refer this article on deploying MVC5 app in IIS. Also please check for the error you are getting and try troubleshooting it as mentioned in this page.
—
Vishwas R
Team CanvasJSYou can modify and customize chart-options dynamically. Adding another dropdown to filter based on department/course should work fine if you handle chart-options accordingly. Below is the code snippet for the same.
var courseName = document.getElementById('courseName');
courseName.addEventListener( "change",  function(){
		var dataSeries;
    for(var i= 0; i < data.length; i++){
        if(data[i].name === courseName.options[courseName.selectedIndex].value){
        			dataSeries = data[i];
              dataSeries.type = selectedChartType;
              chart.options.data = [];
              chart.options.data.push(dataSeries);
        }
        else if(courseName.options[courseName.selectedIndex].value === ""){
        		for(var i = 0; i < data.length; i++){
            		data[i].type = selectedChartType;
            }
    				chart.options.data = data;
        }
    }

    chart.render();
});
Please take a look at this updated jsfiddle.
—
Vishwas R
Team CanvasJSMarco,
Can you kindly create jsfiddle along with sample data, so that we can look into the issue and help you out?
—
Vishwas R
Team CanvasJSPlease download the commercial version from My Account Page. Once downloaded, replacing trial version of the script with commercial version (canvasjs.min.js incase of Chart & canvasjs.stock.min.js incase of StockChart) should work fine. We recommend you to clear the browser cache and try refreshing the page after replacing the script.
—
Vishwas R
Team CanvasJSAlex,
Please check this stackoverflow thread where it says pure JS also works with SPFx. Can you kindly include jquery.canvasjs.min.js and check if that works fine in your case. Incase if you have included jquery.canvasjs.js, kindly include canvasjs.js along with jquery.canvasjs.js.
—
Vishwas R
Team CanvasJSLarry,
Its not possible to get dataSeries color using get method as of now.
However you can get the colorSet of the theme being used with the help of chart._selectedColorSet (which is an interval variable). Please take a look at this jsfiddle.
—
Vishwas R
Team CanvasJSLarry,
You can set the dataPoint value to first dataPoint x-value of any other dataSeries. Please take a look at this updated jsfiddle.
—
Vishwas R
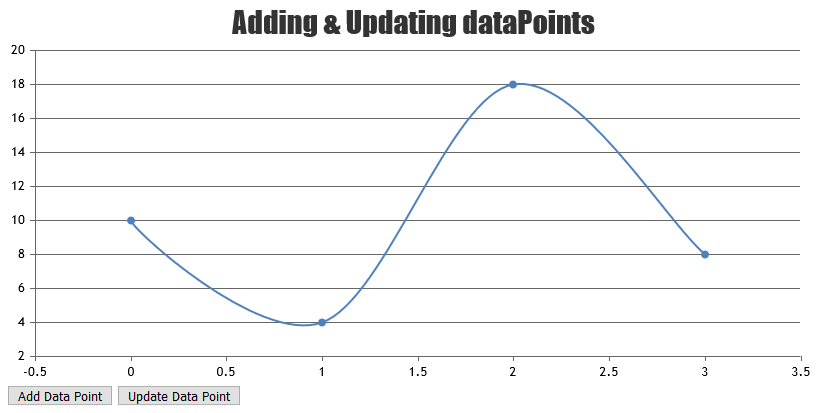
Team CanvasJSYou can update the chart data by changing options and calling
chart.render();. Please refer to this documentation page for step-to-step tutorial on the same.
in your case, you need to group the datapoints from JSON based on year. Please take a look at this updated JSFiddle.Also, we suggest you to initialize chart once before AJAX rather than initializing it on every AJAX calls.
—
Vishwas R
Team CanvasJSRyan,
Font size remains the same even after resize as you are setting indexLabelFontSize to 36. You can change indexLabelFontSize on resize of window and relate it to chart-container width and can have minimum and maximum limits on the same.
Kindly take a look at the code-snippet below,
$(window).resize(function() {

    for(var i = 0; i < chart.options.data.length; i++){
	chart.options.data[i].indexLabelFontSize = Math.min(36, Math.max( 12, $("#chartContainer").width() / 10));
    }
    chart.render();
});
Please take a look at this updated jsfiddle.
—
Vishwas R
Team CanvasJSOne more question, is it possible to switch from multi series chart like stackedBar, stackedColumn graph to pie graph or doughnut graph?
Pie/Doughnut charts doesn’t support multi-series as of now. However switching between stackedBar/stackedColumn to pie/doughnut works fine where chart accepts and renders only first dataSeries.
The data of this graph comes from a json and I dont want to have a duplicate in the year. Can you please tell me whats going on? Thank you. This is my json
Can you kindly create jsfiddle with sample data, so that we can understand it better and help you out?
—
Vishwas R
Team CanvasJSThe behavior is designed such that zooming is limited upto a certain region, so the user doesn’t end up zooming into a blank-region (region with no dataPoints). To zoom into a certain region, there should be a minimum of 3-4 dataPoints.
In your case, zoom doesn’t work as its getting invalidated over axisY. However zoomType: ‘x’ works fine in your case.
We will reconsider this behavior for future releases.
—
Vishwas R
Team CanvasJSPlease refer this documentation page for step-to-step tutorial on rendering chart with data from JSON. Adding another dataseries should let you create multi-series chart. Please find the code-snippet below.
$.getJSON("https://api.npoint.io/bad5c5a9b3669e0ff3ee", function(data) {
for(var i = 0; i < data.length; i++) {
    dps1.push({ label: data[i].label, y: data[i].y1 });
    dps2.push({ label: data[i].label, y: data[i].y2 });
  }
});
Please take a look at this JSFiddle for complete code.

—
Vishwas R
Team CanvasJSGlad that you found another way to handle this case and thanks for sharing the same here, which may help others aswell.
Sorry, animation from bottom to top in case of area chart is not available as of now.
—
Vishwas R
Team CanvasJSYou can set axisX minimum and maximum to the first and last dataPoint value respectively. Please take a look at this updated jsfiddle.
—
Vishwas R
Team CanvasJS