Login to Ask a Question or Reply
Forum Replies Created by Vishwas R
-
Can you kindly share sample project along with sample database over Google-Drive or Onedrive, so that we can look at your code, understand it better and help you out?
This tutorial on Saving/Retrieving BLOB object in Spring MVC might help you handle the scenario you have described above.
—
Vishwas R
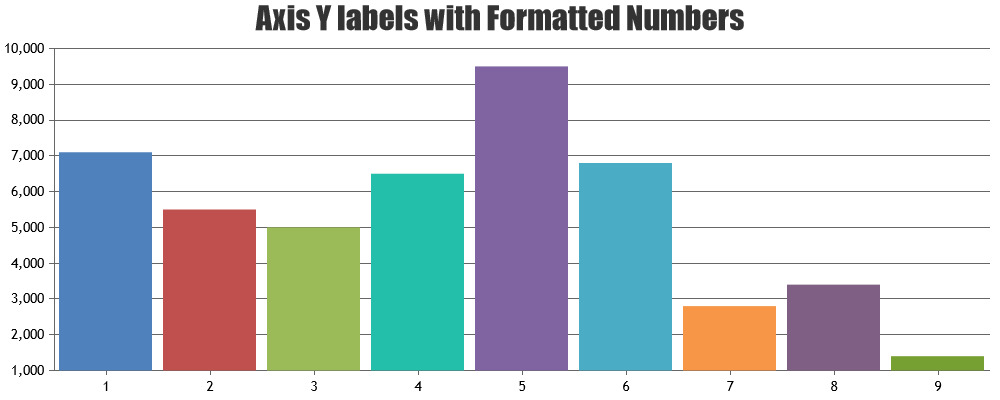
Team CanvasJSvalueFormatString formats the labels appearing on axisY. To format the y-values that appear in toolTip / indexLabel, you should use yValueFormatString. Setting yValueFormatSting to ‘#,##0.00’ should work fine in your case. Please refer documentation on yValueFormatString for more info and formatting options available for the same.
It would be helpful for us to understand your scenario better when we look at your working code live in jsfiddle. So I request you to create jsfiddle and share it with us, rather than pasting code, if you are still facing any issue.
—
Vishwas R
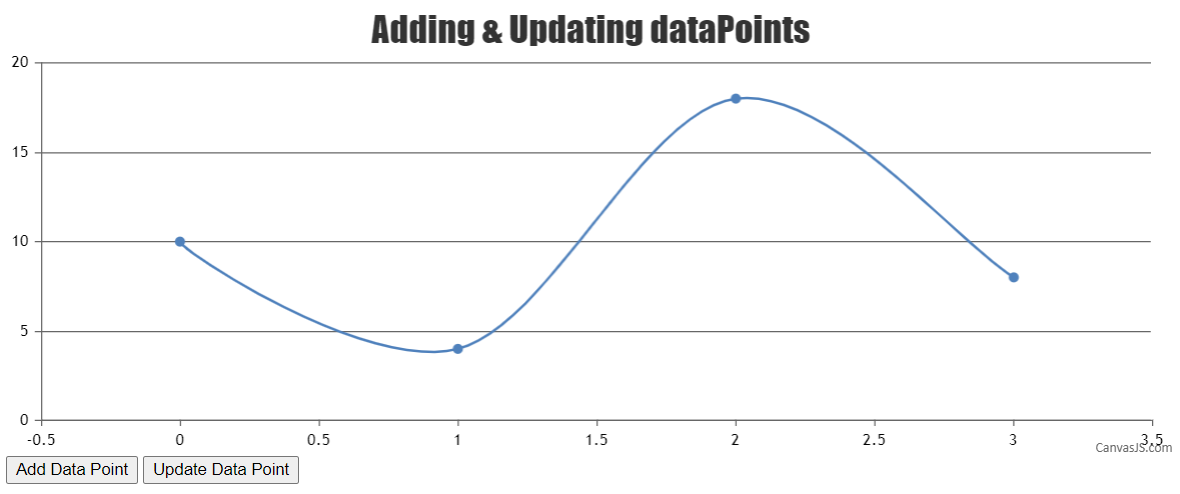
Team CanvasJSPlease refer tutorial on Creating Dynamic Charts for more info on how to update dataPoints dynamically. Also refer tutorial on updating chart options / data.
—
Vishwas R
Team CanvasJSCanvasJS supports rendering any language in title, legend and other elements. You can pass the legend-text in the language you would prefer it to render and it should work fine. Please take a look at this jsfiddle which shows rendering title and legends in Japanese.
a way to retrieve legend labels from JSON file?
Please take a look at this jsfiddle.
—
Vishwas R
Team CanvasJSConsidering this post as duplicate and closing the thread. Please refer the original thread for updates.
—
Vishwas R
Team CanvasJSSetting valueFormatSting to ‘#,##0.00’ seems to be working fine with the y-value that you have shared (114307653.79).
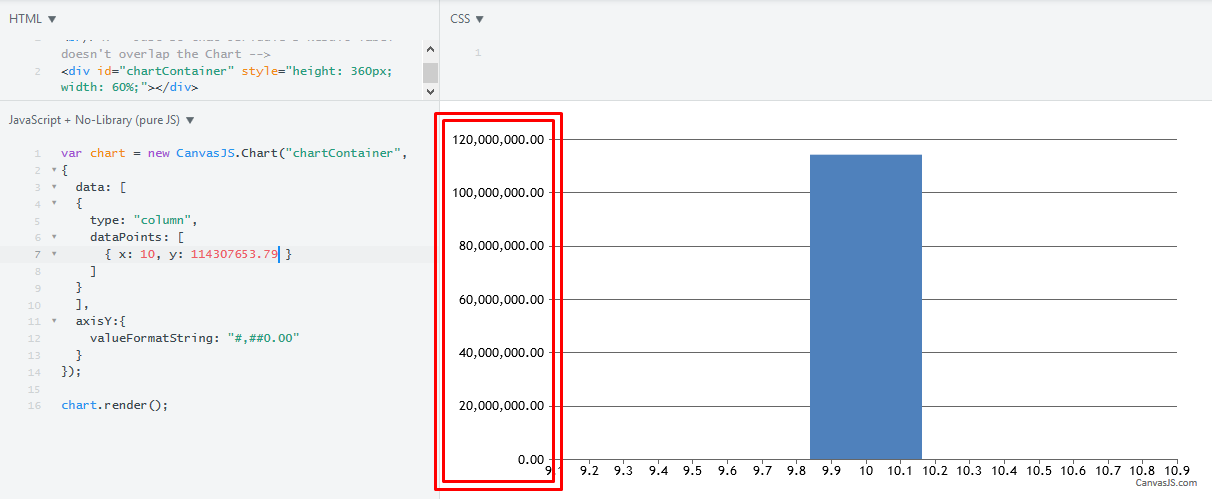
Can you kindly create jsfiddle reproducing the issue you are facing, so that we can look into your code, understand it better and help you out?
—
Vishwas R
Team CanvasJSJuly 23, 2018 at 10:31 am in reply to: how convert blob type in to data url using spring MVC? #21924I don’t see any column with the name ‘file_data’ of the type LONGBLOB in the screenshot that you have shared! Please checkout this tutorial on Saving/Retrieving BLOB object in Spring MVC.
If there is any issue integrating CanvasJS in your Spring MVC project, please download the Sample project from our download page. If you have any other issues, kindly create sample project along with sample database and share it over Google-Drive or Onedrive so that we can look into your code, understand it better and help you out?
—
Vishwas R
Team CanvasJSYou can post your question in forum by clicking ‘Ask Question’ button available in the top of the page in every forum. Please refer the screenshot below.

—
Vishwas R
Team CanvasJSYou are trying to update visible property directly and not through chart-options. Updating chart options should work fine in this case. Can you kindly update your code to
chart.options.data[i].visible = false;instead ofchart.data[i].visible = false;and the same in ShowAll() aswell.If this doesn’t solve your issue, kindly create jsfiddle reproducing the issue, so that we can look in to your code, understand it better and help you out.
—
Vishwas R
Team CanvasJSThanks for reporting. We will look into the issue and fix it in the future releases.
—
Vishwas R
Team CanvasJSif I want to move the point inside the chart shoud i use draggable function ? is the drag of a point supported?
You can overlay custom DOM on top of chart, please refer Chart with Image Overlay for an example on the same.
Dragging and updating the dataPoint is possible in CanvasJS. Please refer ‘Interactivity Example’ in Features section of our homepage for the same. Also please take a look at an example in out gallery on Draggable Column Chart.
can I also keep more points like D, F, G at the same time?
Yes, you can have as many dataPoints and legends as you want.
—
Vishwas R
Team CanvasJSJuly 20, 2018 at 10:03 am in reply to: Bubble Chart – Zoom Enabled does not support custom legend #21905July 19, 2018 at 1:13 pm in reply to: Bubble Chart – Zoom Enabled does not support custom legend #21888The behavior of zooming in your case is due to number of dataPoints in each dataSeries. We will reconsider this behavior for future releases.
Showing legends to every dataPoint in bubble chart is not possible, as of now. I would suggest you to use single dataSeries with custom legends as shown in this jsfiddle.
If you have any other queries / issues, kindly create jsfiddle reproducing the issue and share the same.
—
Vishwas R
Team CanvasJS