Login to Ask a Question or Reply
Forum Replies Created by Vishwas R
-
Shift is a JavaScript array method that removes the first element from an array whereas slice is an array method that returns a shallow copy of a portion of an array. You can use slice method to remove specific number of elements from dataPoints array.
—
Vishwas R
Team CanvasJSAugust 6, 2018 at 2:25 pm in reply to: Canavas Chart is not supporting X-Pages IBM Domino Platform #22135The code that you have shared seems to be working fine across browsers. Can you kindly share sample project reproducing the issue over Google-Drive or Onedrive so that we can look into it and help you out?

—
Vishwas R
Team CanvasJSAugust 6, 2018 at 1:20 pm in reply to: Canavas Chart is not supporting X-Pages IBM Domino Platform #22131Based on the error that you have shared
Uncaught ReferenceError: CanvasJS is not defined., it seems like CanvasJS script is not loaded in your application. Can you kindly try after adding script in your app?The HTML code that you have shared seems to be working fine. It would be helpful for us to understand the issue you are facing if you could share your app reproducing the issue over Google-Drive or Onedrive.
—
Vishwas R
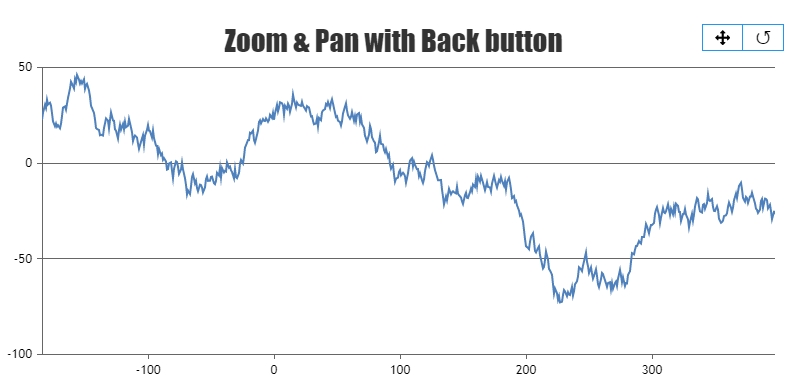
Team CanvasJS@leo,
You can overlay the zoom-back button on top of reset button to perform zoom-out step-by-step on clicking reset button. Please find the code snippet below.
function back(){
  var viewportMinStack = chart.options.viewportMinStack;
  var viewportMaxStack = chart.options.viewportMaxStack;
  //if(!chart.axisX){
  //		chart.axisX = {};
  //	}
  if(viewportMinStack.length>1){
    viewportMinStack.pop();
    viewportMaxStack.pop();
    axisX.viewportMinimum = viewportMinStack[viewportMinStack.length-1];
    axisX.viewportMaximum = viewportMaxStack[viewportMaxStack.length-1];
  }
  else{
    axisX.viewportMinimum = null;
    axisX.viewportMaximum = null;
    document.getElementById("button").style.visibility = "hidden";
  }
  chart.render();
}
var button = document.getElementById( "button" );
button.addEventListener("click", back);
document.getElementsByClassName("canvasjs-chart-toolbar")[0].lastChild.style.visibility = 'hidden';
Please take a look at this updated JSFiddle for complete code.
—
Vishwas R
Team CanvasJSPlease refer Chart Data from Database for an example on rendering chart with data from database.
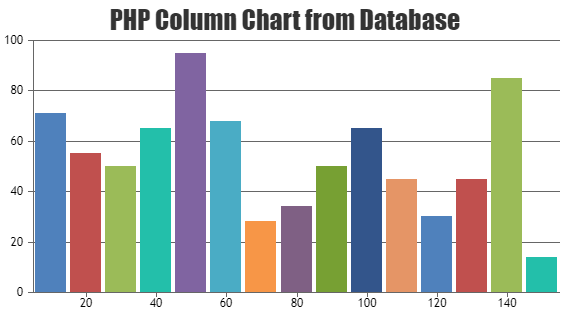
You can also download PHP samples from our Download Page and checkout the examples.—
Vishwas R
Team CanvasJSPlease take a look at updated jsfiddle showing chart similar to the image that you have shared – achieved using stackedColumn Chart.
—
Vishwas R
Team CanvasJSYou can set filled area color using color property and the color of the line/border of area using lineColor. Please refer documentation for list of chart options / more info.
—
Vishwas R
Team CanvasJSTo convert PHP date to JavaScript timestamp, first you need to convert PHP date to PHP timestamp using strtotime and then convert PHP timestamp to JavaScript timestamp by multiplying PHP timestamp by 1000.
$phpDate = date("Y-m-d h:i:sa");
$phpTimestamp = strtotime($phpDate);
$javaScriptTimestamp = $phpTimestamp * 1000;
—
Vishwas R
Team CanvasJSYou can use stackedColumn chart as shown in this jsfiddle. You can customize color of dataPoint (columns) by using color property.
—
Vishwas R
Team CanvasJSTo change the color of line in line or area charts, you can set lineColor to your desired color. To show gridlines over both axisX and axisY, you can set gridThickness in axis, which defaults to 0 incase of axisX.
—
Vishwas R
Team CanvasJSAugust 1, 2018 at 6:20 pm in reply to: Combine CSV chart with one column with another chart that has two columns. #22080You are observing this behaviour as the first dataSeries is attached to primary axisY and the second dataSeries is attached to secondary axisY. Both axis have different range hence the height of the column varies according to their respective axis range.
—
Vishwas R
Team CanvasJS