Login to Ask a Question or Reply
Forum Replies Created by Vishwas R
-
August 28, 2018 at 10:03 am in reply to: How to hide the secondary graph but not the axis label #22405
Can I do the same from an outer function without click on legend ?
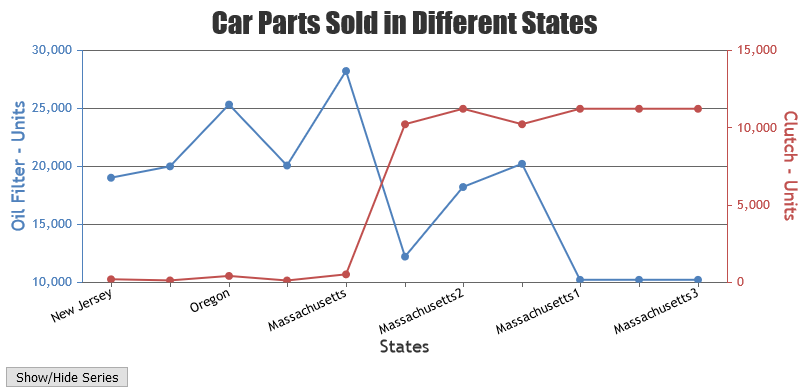
You can hide / unhide dataSeries by toggling visible property of dataSeries. Please take a look at this updated JSFiddle, where all dataSeries are hidden / shown on clicking a button.
I do not need legend in my application.
Legends will be shown when showInLegend is set to true, defaults to false. So legends will not be shown in the chart by setting showInLegend to false or by not setting the property at all.
—
Vishwas R
Team CanvasJSYou can add margin to axisY to avoid first label being clipped. Please take a look at this updated jsfiddle.
Alternately, you can remove first label using labelFormatter as shown in this jsfiddle.
—
Vishwas R
Team CanvasJSAugust 27, 2018 at 9:48 am in reply to: Is it possible to display the toolTips for every point at once? #22391@ayy,
You can use indexLabels to show information about dataPoint ratherthan trying to show toolTip at every dataPoint. Please take a look at this jsfiddle.
—
Vishwas R
Team CanvasJSCan you kindly share sample project reproducing the issue you are facing over Google-Drive or Onedrive so that we can look at your code, understand the scenario better and help you out?
—
Vishwas R
Team CanvasJS@leo,
You are facing this issue as the dataPoints that you are passing to chart doesn’t have y-value whereas within toolTip contentFormatter you are trying to access y-value, which is basically undefined. Removing y-value within contentFormatter should work fine in your case. Please take a look at this updated jsfiddle.

—
Vishwas R
Team CanvasJSYou can try adding another dataSeries of error type with whiskerLength and stemThickness set to 0. Please take a look at this jsfiddle.
—
Vishwas R
Team CanvasJSJust like adding new dataPoints to the chart as shown in the tutorial, you can dynamically create chart as well. Please take a look at this jsfiddle.
—
Vishwas R
Team CanvasJSPlease take a look at this tutorial on rendering chart with dataPoints from user input.
Also refer our gallery section for example on JSP and Spring MVC. You can also download working samples from our download page and try running it locally.
—
Vishwas R
Team CanvasJSCan you kindly create a sample project reproducing the issue you are facing and share it over Google-Drive or Onedrive so that we can look into your code, understand it better and help you out?
—
Vishwas R
Team CanvasJSBorder to columns / bars (dataPoints) are not available as of now. However with few lines of code, you can achieve the same as shown in this jsfiddle.
—
Vishwas R
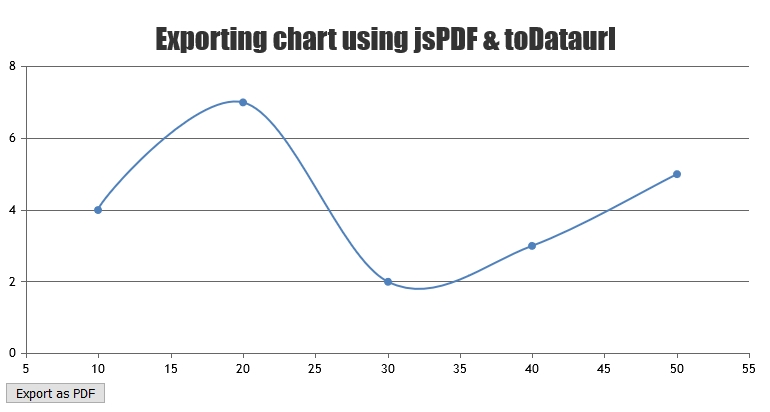
Team CanvasJSWe don’t have exporting chart as pdf as an inbuilt feature as of now. However with couple of lines of code you can export chart as pdf using jsPDF. Please find the code-snippet below.
var pdf = new jsPDF();
pdf.addImage(dataURL, 'JPEG', 0, 0);
pdf.save("download.pdf");
Please take a look at this JSFiddle for complete code.
To export multiple charts present in a page, you can merge all charts into single using html2canvas. And then you can export the merged images to pdf using jspdf. Please take a look at this JSFiddle for an example on the same.
Exporting more than 5 charts also seems to be working fine, when you configure html2canvas options accordingly. Please take a look at this updated JSFiddle. Please refer html2canvas documentation for more configuration options available and configure it in your webpage / app accordingly.
—
Vishwas R
Team CanvasJS-
This reply was modified 5 years ago by
Vishwas R.
@leo,
Email Based Support is available in Priority Support licenses with turnaround time of 24 hours. One of our team member will get in touch with you soon over mail.
—
Vishwas R
Team CanvasJSAugust 21, 2018 at 9:35 am in reply to: Zero line in line chart for second yaxis without further grid #22337Streifix,
You can set gridThickess to 0 to remove grids from any axis.
If this doesn’t solve your requirement, kindly create jsfiddle with the issue you are facing so that we can look into the code and chart-options that you are using, understand it better and help you out.
—
Vishwas R
Team CanvasJSPlease refer tutorial on adding Charts to ASP.NET MVC Applications.
If you are using other technologies like Spring MVC or PHP etc, you can download working sample examples from our download page and try out locally. Also refer examples for ASP.NET MVC, Spring MVC, PHP in Integration section.
—
Vishwas R
Team CanvasJS -
This reply was modified 5 years ago by