Login to Ask a Question or Reply
Forum Replies Created by Vishwas R
-
Thanks for sharing the use-case. We will look into it & fix the same in the future versions.
—
Vishwas R
Team CanvasJSChart seems to be working fine with the chart-options that you have shared. Can you kindly create sample project reproducing the issue you are facing & share it with us over Google-Drive or Onedrive so that we can look into the complete code, run it locally to understand the scenario better and help you out?
—
Vishwas R
Team CanvasJSThanks for sharing the fix. But, having a use-case that reproduces the issue helps us understand the scenario better. Modifying the source-code to make it work with one use-case might cause few other issues or it might break in other use-cases. Hence I request you to share a reproducible sample or JSFiddle so that we can find the root-cause & fix it, if it’s a bug.
—
Vishwas R
Team CanvasJSThe response that you are passing to view seems to be string & not JSON. Passing JSON seems to be working fine. Please download updated sample from here.
—
Vishwas R
Team CanvasJSRagu Nathan,
Tooltip can be hidden for particular dataseries by setting toolTipContent to null. In case of shared tooltip, setting toolTipContent to null will hide information related to that particular dataseries from the tooltip.
—
Vishwas R
Team CanvasJSMay 12, 2022 at 6:54 pm in reply to: problem with auto-calculation of viewportMinimum/Maximum for navigator #37712Thanks for your valuable feedback. We will reconsider this behavior in future.
—
Vishwas R
Team CanvasJSCan you kindly create sample project reproducing the issue you are facing and share it with us over Google-Drive or Onedrive so that we can run it locally at our end, understand the scenario better and help you out?
—
Vishwas R
Team CanvasJSRagu Nathan,
Sorry, it’s not possible to show tooltip for nearest datapoint when you hover a datapoint – even when tooltip is hidden for particular dataseries.
—
Vishwas R
Team CanvasJSRagu Nathan,
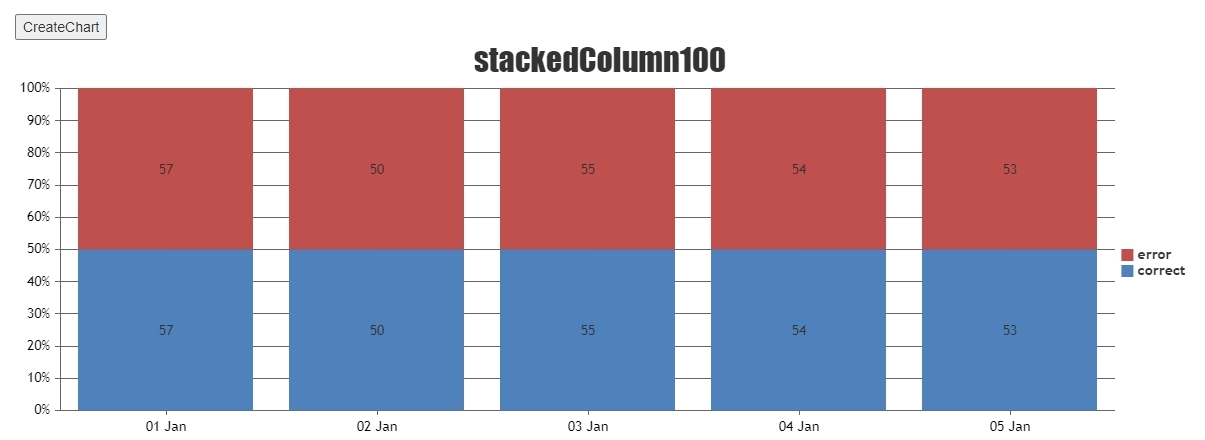
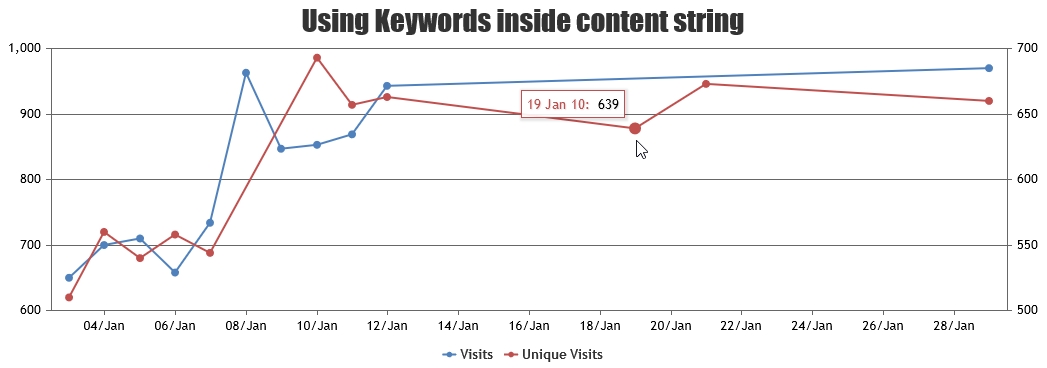
You can set toolTipContent to null in dataseries level to hide tooltip for particular dataseries when shared is set to false. Please take a look at this JSFiddle for an example.
However, the same can be done using contentFormatter as well. In this case, you will have to loop through all the entries & generate tooltip content to hide information related to one of the dataseries. Please find the code-snippet below.
contentFormatter: (e) => {
  var content = "";
  for(var i = 0; i < e.entries.length; i++) {
    if (e.entries[i].dataSeries.name != "Visits") {
      content += e.entries[i].dataSeries.name + " - " +  e.entries[0].dataPoint.y;
    }
  }
  return content === "" ? null : content;
}
Please take a look at this updated JSFiddle for complete code.
—
Vishwas R
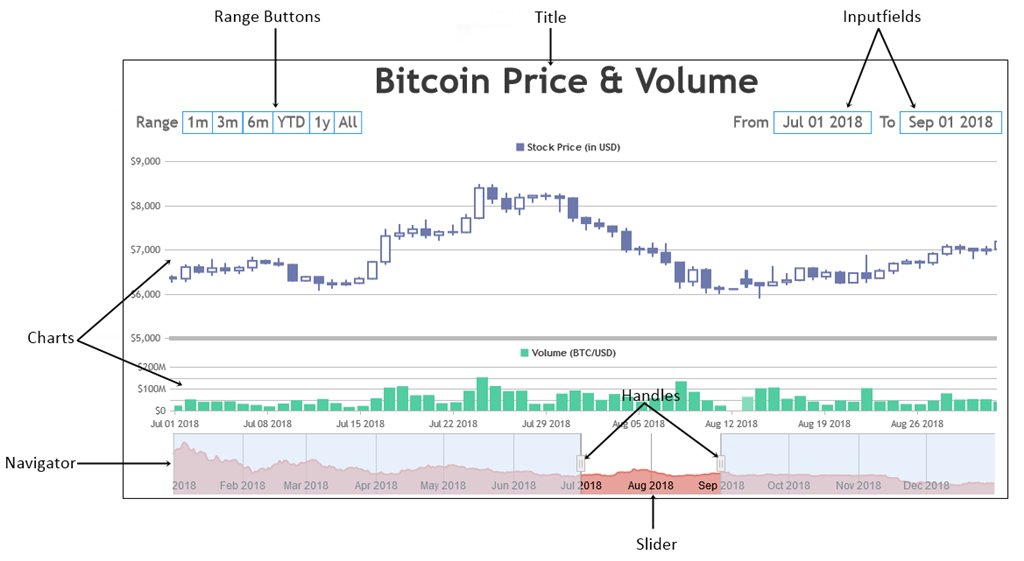
Team CanvasJSMay 6, 2022 at 8:12 pm in reply to: problem with auto-calculation of viewportMinimum/Maximum for navigator #37661Navigator is part of Stockchart and it shares the same x-axis range as the data present in all the charts. When navigator has different range than charts, it can’t give the preview of all the data present within the chart. When there is huge dataset, it might not be possible to zoom into smaller region using navigator. In such cases, you can use range-selector – either custom range buttons with smaller ranges or inputFields.
This combined with my previously submitted bug of not being able to zoom into “open-ended” regions means that it is effectively impossible for a user to zoom into the given region.
You can overcome this by setting minimum & maximum as addressed in the other topic.
—
Vishwas R
Team CanvasJSZoom / Pan behavior is designed such that zooming is limited upto a certain region, so that user doesn’t end up zooming into a blank-region (region with no dataPoints). To zoom into a certain region, there should be a minimum of 3-4 dataPoints over the axis. Please refer to this forum thread for more information. Also, one can’t zoom outside the actual axis range (minimum & maximum). In your case, it’s getting cancelled as zooming happens outside the axis range. You can handle this by setting minimum and maximum of charts based on navigator.
stockChart.charts[0].axisX[0].set("minimum", stockChart.navigator.axisX[0].get("minimum"), false);
stockChart.charts[0].axisX[0].set("maximum", stockChart.navigator.axisX[0].get("maximum"));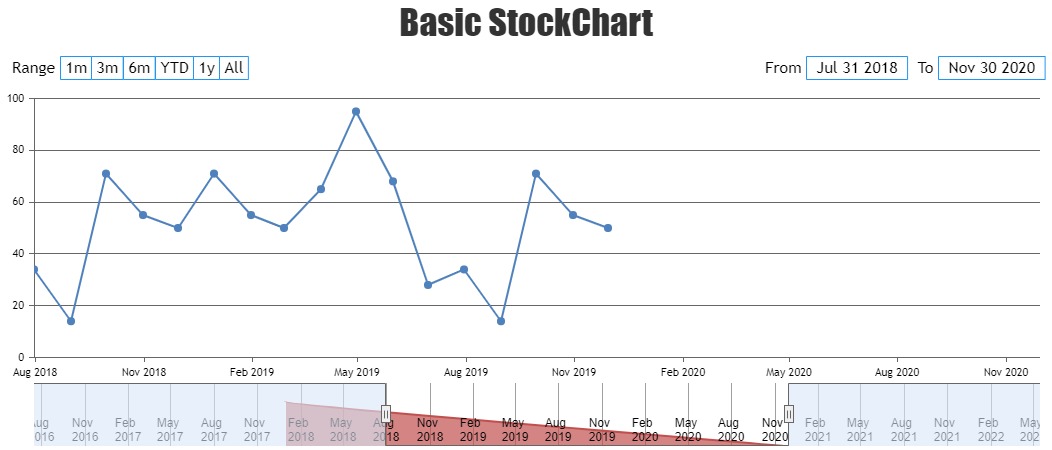
Please take a look at this updated JSFiddle for working code.—
Vishwas R
Team CanvasJSAdam Pallozzi,
I assume every time I update CanvasJS I will lose my changes?
Yes, you will have to update your source-code on every product release / update.
Would you guys consider making a plugin system where we could register a module like that as a plugin so we don’t need to recreate it on each update?
Thanks for the suggestion. We will reconsider this suggestion for our future releases.
—
Vishwas R
Team CanvasJSAdam Pallozzi,
Thanks for being a valuable customer of CanvasJS.
Please follow the below steps to add custom marker to CanvasJS Chart.
1. Add marker drawing logic in the end of drawMarker method of canvasjs.js (Source-Code) downloaded from My Account page.else if(markerType === "customMarkerType") { //marker drawing logic }2. Define the newly added markerType in dataseries
data: [{
    .
    .
    markerType: "customMarkerType"
    .
}]
Below code-snippet will help you in adding star as marker-type to CanvasJS Chart.
//Add the below lines at the end of drawMarker method
else if (markerType === "star") {
    var points = 6;
    ctx.strokeStyle = markerColor;

    ctx.beginPath();
    ctx.moveTo(x, y + markerSize);
    for (var i = 0; i < 2 * points + 1; i++) {
        var r = (i % 2 == 0) ? markerSize : markerSize / 2;
        var a = Math.PI * i / points;
        ctx.lineTo(x + r * Math.sin(a), y + r * Math.cos(a));
    };
    ctx.closePath();

    if (markerColor)
        ctx.fill();
}

//Define marker-type in chart-options
data: [{
    ...
    markerType: "star",
}]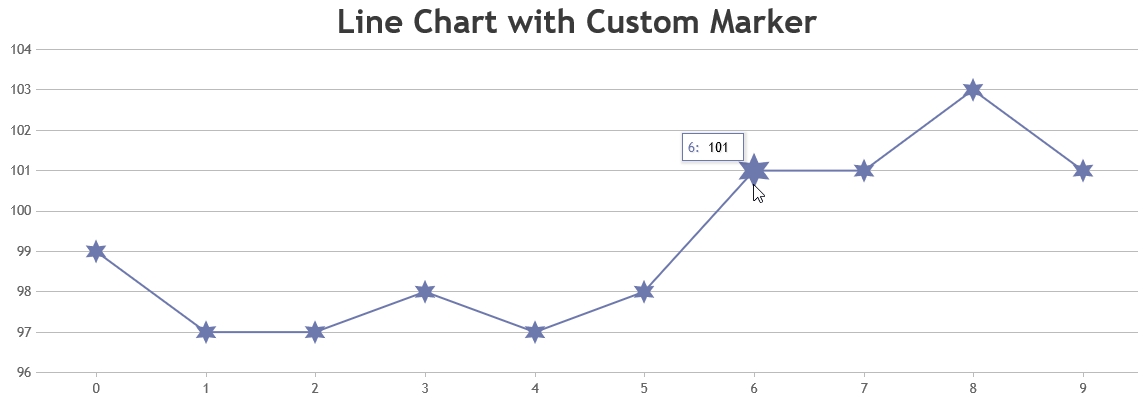
—
Vishwas R
Team CanvasJSConsidering this as duplicate of Assigning different colors on toolTip. Hence closing the same.
—
Vishwas R
Team CanvasJSTooltip accepts the color of datapoint as it’s border-color by default & it seems to be working fine. Please refer to the screenshot below.
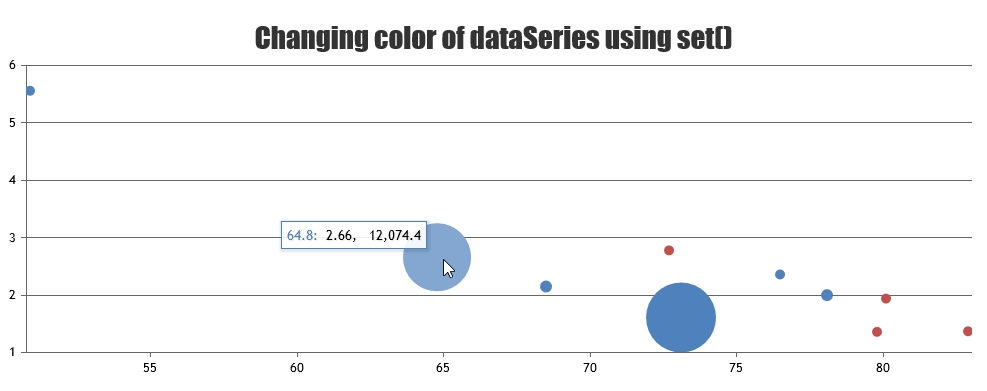
If you are still facing issue, can you kindly create JSFiddle & share it with us so that we can look into the code / chart-options being used, understand the scenario better and help you out?
—
Vishwas R
Team CanvasJS