Login to Ask a Question or Reply
You must be logged in to post your query.
Home › Forums › Chart Support › 2 cursor for chart
2 cursor for chart
- This topic has 5 replies, 4 voices, and was last updated 4 years, 6 months ago by
Vishwas R.
-
February 8, 2019 at 3:35 pm #24259
Hello Canvas JS team,
How can we add two cursor on chart in order to select the data range.
Thanks,
TejalFebruary 11, 2019 at 10:31 pm #24280December 21, 2021 at 10:42 pm #36550Hi,
I understand the feature is not available…if someone had source could they implement it, or are there limitations to how CanvasJs is designed/architected where this could not be technically accomplished?
Thanks!
-ben
-
This reply was modified 4 years, 7 months ago by
benhysell.
December 22, 2021 at 6:30 pm #36563Ben,
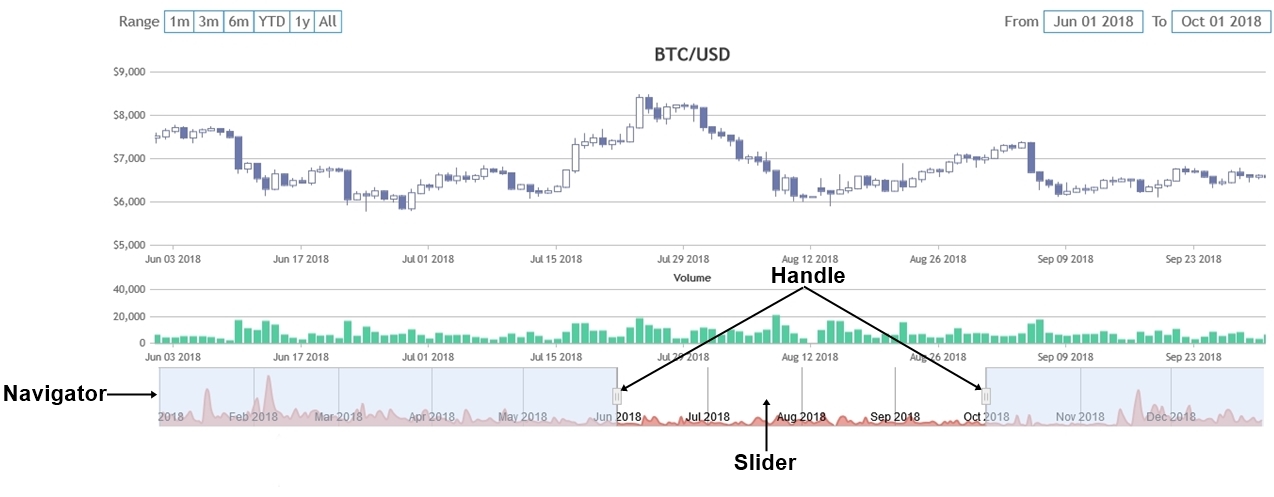
You can use navigator to select a range of data to be shown in chart. If this doesn’t fulfill your requirements, can you kindly brief us more along with an example or a pictorial representation of your requirements so that we can understand it better and help you out?
—
Vishwas R
Team CanvasJSDecember 28, 2021 at 10:26 am #36565Vishwas,
Think oscilloscope and cursor measurements. See – https://www.tmatlantic.com/encyclopedia/index.php?ELEMENT_ID=8930
From the link:
“Cursor measurements” is the mode in which an oscilloscope determines the cursors positions on Y- or X-axes and calculates the difference between these cursors positions.Image from their website detailing desired functionality
I wouldn’t expect CanvasJS to do any of the desired math/calculations on the data, that is outside of CanvasJS, I need the ability to place those cursors and return cursor positions.
Detailed Desired Functionality with CanvasJS:
– Place a cursor on the screen and have cursor “stick” at a location after a user left clicks
– Place a second cursor on the screen and have cursor “stick” at a location after a user left clicks
– Ability to return from CanvasJS cursor positions so I can perform calculations on the data outside of the control
– Ability to move the cursor after placing it by left clicking on the cursor and moving it to a new positionDecember 28, 2021 at 6:19 pm #36603Ben,
You can achieve this by using striplines. You can dynamically add stripline on clicking anywhere on the chart using addTo method. Also, you can make them draggable using mouse-events as shown in the below code-snippet.
$(".canvasjs-chart-canvas").last().on("mousedown", function(e) {
  // Get the selected stripLine & change the cursor
  var parentOffset = $(this).parent().offset();
  var relX = e.pageX - parentOffset.left;
  var relY = e.pageY - parentOffset.top;
  var snapDistance = 10;

  for(var i = 0; i < chart.options.axisX[0].stripLines.length; i++) {
    if(relX > chart.axisX[0].stripLines[i].get("bounds").x1 - snapDistance && relX < chart.axisX[0].stripLines[i].get("bounds").x2 + snapDistance && relY > chart.axisX[0].stripLines[i].get("bounds").y1 && relY < chart.axisX[0].stripLines[i].get("bounds").y2) {
      selected = i;
      $(this).css("cursor","pointer");
    }
  }
});

$(".canvasjs-chart-canvas").last().on("mousemove", function(e) {
  // Move the selected stripLine
  if(selected !== -1) {
    var parentOffset = $(this).parent().offset();
    var relX = e.pageX - parentOffset.left;
    chart.options.axisX[0].stripLines[selected].value = chart.axisX[0].convertPixelToValue(relX);
    chart.render();
  }
});

$(".canvasjs-chart-canvas").last().on("mouseup", function(e) {
  // Clear Selection and change the cursor
  selected = -1;
  $(this).css("cursor","default");
});
Please take a look at this JSFiddle for working code.
—
Vishwas R
Team CanvasJS -
This reply was modified 4 years, 7 months ago by
You must be logged in to reply to this topic.