Login to Ask a Question or Reply
Forum Replies Created by Vishwas R
-
February 22, 2016 at 10:55 am in reply to: How to allow user to change variable that chart is based on #9901
xkater,
It is possible to change/update axis’s range by using viewportMinimum and viewportMaximum properties of axisX. I think you can implement the required behavior using these two properties.
Here is an example with a slider – you might have to customize it slightly though.
If this doesn’t fit your requirement, any pictorial representation or fiddle would be helpful to understand your requirement and help you out.
Aviran,
We checked your issue, we tried debugging it locally. Kindly make few changes to get it work. Instead of using window.onload, use $(document).ready. And before loading jquery.canvasjs (js file), load jquery file.
Here is the working code-snippet:
<script type="text/javascript" src="https://code.jquery.com/jquery-2.2.0.min.js"></script> <script type="text/javascript" src="http://ticket-compare.com/wp-content/themes/ticket-compare/js/jquery.canvasjs.min.js"></script> <script type="text/javascript"> $(document).ready(function() { var chart = new CanvasJS.Chart("chartContainer", { title:{ text: "Price History, In Pounds" }, animationEnabled: true, axisY:{ titleFontFamily: "arial", titleFontSize: 12, includeZero: false }, toolTip: { shared: true }, data: [ { type: "spline", name: "ticketbis", showInLegend: true, dataPoints: [ {label:"6-02-16", y: 254.02}, {label: "7-02-16", y: 264.99}, {label: "8-02-16", y: 264.99}, {label: "9-02-16", y: 290.00}, {label: "10-02-16", y: 285.00}, {label: "11-02-16", y: 369.00}, {label: "12-02-16", y: 329.30} ] }, { type: "spline", name: "livefootball", showInLegend: true, dataPoints: [ {label:"6-02-16", y: 237.50}, {label: "7-02-16", y: 237.50}, {label: "8-02-16", y: 237.50}, {label: "9-02-16", y: 237.50}, {label: "10-02-16", y: 237.50}, {label: "11-02-16", y: 0}, {label: "12-02-16", y: 469.25} ] }, { type: "spline", name: "Kix", showInLegend: true, dataPoints: [ {label:"6-02-16", y: 220}, {label: "7-02-16", y: 220}, {label: "8-02-16", y: 220}, {label: "9-02-16", y: 320}, {label: "10-02-16", y: 320}, {label: "11-02-16", y: 320}, {label: "12-02-16", y: 320} ] }, { type: "spline", name: "Sports Events 365", showInLegend: true, dataPoints: [ {label:"6-02-16", y: 357}, {label: "7-02-16", y: 356}, {label: "8-02-16", y: 356}, {label: "9-02-16", y: 357}, {label: "10-02-16", y: 363}, {label: "11-02-16", y: 404}, {label: "12-02-16", y: 410} ] }, { type: "spline", name: "FootballTicketpad", showInLegend: true, dataPoints: [ {label:"6-02-16", y: 823.53}, {label: "7-02-16", y: 823.53}, {label: "8-02-16", y: 823.53}, {label: "9-02-16", y: 823.53}, {label: "10-02-16", y: 941.18}, {label: "11-02-16", y: 0}, {label: "12-02-16", y: 47.07} ] }, { type: "spline", name: "HotFootballTickets", showInLegend: true, dataPoints: [ {label:"6-02-16", y: 290}, {label: "7-02-16", y: 324}, {label: "8-02-16", y: 314}, {label: "9-02-16", y: 330}, {label: "10-02-16", y: 330}, {label: "11-02-16", y: 402}, {label: "12-02-16", y: 402} ] }, { type: "spline", name: "guaranteetickets", showInLegend: true, dataPoints: [ {label:"6-02-16", y: 299.71}, {label: "7-02-16", y: 299.71}, {label: "8-02-16", y: 300.10}, {label: "9-02-16", y: 300.88}, {label: "10-02-16", y: 308.65}, {label: "11-02-16", y: 305.72}, {label: "12-02-16", y: 305.72} ] }, { type: "spline", name: "ticket2", showInLegend: true, dataPoints: [ {label:"6-02-16", y: 465.34}, {label: "7-02-16", y: 463.92}, {label: "8-02-16", y: 463.92}, {label: "9-02-16", y: 464.01}, {label: "10-02-16", y: 464.01}, {label: "11-02-16", y: 503.68}, {label: "12-02-16", y: 503.57} ] }, ], legend:{ cursor:"pointer", itemclick:function(e){ if(typeof(e.dataSeries.visible) === "undefined" || e.dataSeries.visible) { e.dataSeries.visible = false; } else { e.dataSeries.visible = true; } chart.render(); } } }); chart.render(); }); </script> </div> <div id="chartContainer" style="height: 100%; width: 100%; padding-bottom: 45%;"></div> </div>Aviran,
Upon checking the URL that you have shared, we observed an error in console – ‘$ is not a function’. This means a jQuery function is called before jQuery (js file) is loaded. Kindly check and load jQuery before using jQuery functionality,
If you are using CanvasJS jQuery plugin, please load jQuery before loading CanvasJS jQuery plugin as it has dependency. Please refer to this documentation page for tutorial and live examples on using jQuery plugin. Also please refer to jQuery Gallery for more examples with different sets of use-cases that you can edit in-browser or download to run locally.
—
Vishwas R
Team CanvasJSBasu,
If you are using column or bar chart types, you can set color to multiple dataSeries . Here is an example. And if it is for line chart, you can set multiple dataSeries as shown in this example to achieve it
Samushenkov, we have checked and verified that the expression is correct. In case if you like to show-up more number of ticks, you can use interval
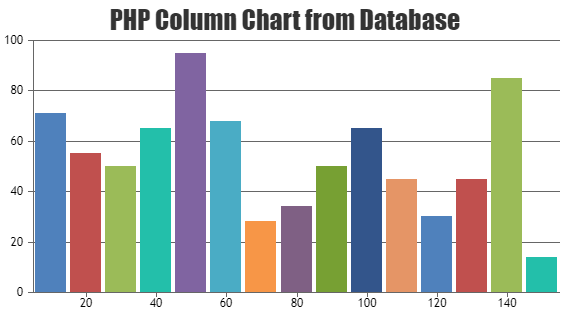
February 5, 2016 at 11:59 am in reply to: How can I use PHP MySQL data to create a bar chart like this #9849Can you kindly provide us sample JSON, so that we can look into it and check the issue?
Please refer to this gallery page for an example on rendering chart with data from database. Also refer to this thread for more information on the same.
—
Vishwas R
Team CanvasJSHi Od,
It’s a known issue in spline that the spline is overshoots, and it will be resolved in future versions. The clipping towards axis in line is as per design, as user can set thickness and it overlaps the axis and other elements, to avoid this kind of issues, line will be clipped.
February 3, 2016 at 12:39 pm in reply to: Spline Chart not plotting all the datas from text file #9844Basu,
Can you kindly provide the content/format of data your file contains, so that we can look into it and help you in this regard.
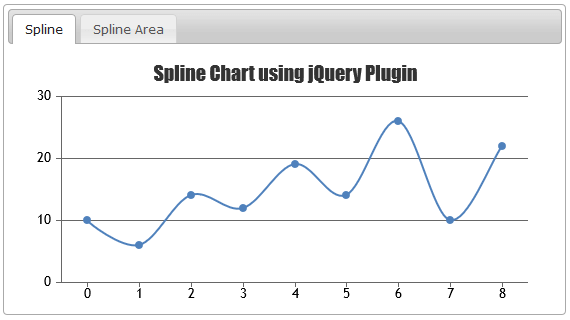
January 27, 2016 at 4:45 pm in reply to: Canvas JS chart not displayed properly in Bootstrap tabs #9830Rajrs,
CanvasJS Chart automatically sets the height and width of the chart according to container’s dimensions. If the values are not set for the container, it takes the default values.
In bootstrap, since the second tab is not displayed initially, chart takes the default values. To solve this issue, second chart is rendered when the shown.bs.tab event is fired by bootstrap.
Here is the working code for the same.
—
Vishwas R
Team CanvasJSWe just looked into your JSON API and its returning 0 every time. If you can make it return some data we would be able help you in updating the chart.
You cannot send function as part of JSON data directly. Though you can serialize function on the server before sending, this is generally not suggested. Instead we suggest adding these event handlers on the client side after receiving the json data.