Login to Ask a Question or Reply
You must be logged in to post your query.
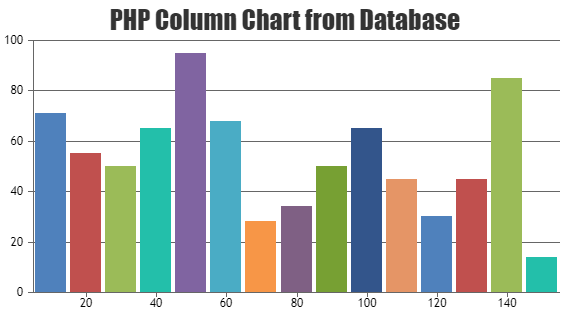
Home › Forums › Chart Support › How can I use PHP MySQL data to create a bar chart like this
How can I use PHP MySQL data to create a bar chart like this
- This topic has 1 reply, 2 voices, and was last updated 10 years, 5 months ago by
Vishwas R.
-
January 29, 2016 at 10:42 am #9837
This is my data.php
<?phpheader(‘Content-Type: application/json’);
include(“dbFunctions.php”);
$data_points1 = array();
$data_points2 = array();
$data_points3 = array();$result1 = mysqli_query($link,”SELECT facility_cat, COUNT(facility_cat) WHERE YEAR(CURDATE()) -2 FROM
bookingGROUP BY facility_cat”);
$result2 = mysqli_query($link,”SELECT facility_cat, COUNT(facility_cat) ,YEAR(CURDATE()) -1 FROMbookingGROUP BY facility_cat”);
$result3 = mysqli_query($link,”SELECT facility_cat, COUNT(facility_cat) ,YEAR(CURDATE()) FROMbookingGROUP BY facility_cat”);while($row = mysqli_fetch_array($result1))
{
$point1 = array(“indexLabel” =>$row[‘facility_cat’], “label” => $row[‘facility_cat’] , “y” => $row[‘COUNT(facility_cat)’]);array_push($data_points1, $point1);
}while($row = mysqli_fetch_array($result2))
{
$point2 = array(“indexLabel” =>$row[‘facility_cat’], “label” => $row[‘facility_cat’] , “y” => $row[‘COUNT(facility_cat)’]);array_push($data_points2, $point2);
}
while($row = mysqli_fetch_array($result3))
{
$point3 = array(“indexLabel” =>$row[‘facility_cat’], “label” => $row[‘facility_cat’] , “y” => $row[‘COUNT(facility_cat)’]);array_push($data_points3, $point3);
}echo json_encode($data_points1, JSON_NUMERIC_CHECK);
echo json_encode($data_points2, JSON_NUMERIC_CHECK);
echo json_encode($data_points3, JSON_NUMERIC_CHECK);mysqli_close($link);
?>
This is my DataBarChart.php
<?php
include(“dbFunctions.php”);
session_start();?>
<html>
<head>
<meta http-equiv=”Content-Type” content=”text/html; charset=utf-8″ />
<link href=”stylesheets/style.css” rel=”stylesheet”/>
<script type=”text/javascript” src=”script/jquery.validate.min.js”></script>
<script type=”text/javascript” src=”script/canvasjs.min.js”></script></head>
<script type=”text/javascript” src=”js/jquery-1.6.1.min.js”></script></head>
<title>Online Booking System</title>
<script type=”text/javascript”>
$(document).ready(function () {$.getJSON(“DataBarChart.php”, function (result1,result2,result3) {
var chart = new CanvasJS.Chart(“BarChart”, {
theme: “theme2”,
title:{
text: “Bookings over the years”
},
exportFileName: “Bookings over the years”, //Give any name accordingly
exportEnabled: true,
axisY: {
includeZero: false,},
axisX: {
interval: 10
},
axisY: {
title: “Number of Bookings Made over the years”,
maximum: 250
},data: [
{
type: “bar”,
showInLegend: true,
toolTipContent: “{y} – #percent %”,
legendText: “{indexLabel}”,
color: “gold”,
dataPoints: result1
},
{
type: “bar”,
showInLegend: true,
toolTipContent: “{y} – #percent %”,
legendText: “{indexLabel}”,
color: “silver”,
dataPoints: result2
},
{
type: “bar”,
showInLegend: true,
toolTipContent: “{y} – #percent %”,
legendText: “{indexLabel}”,
color: “#DCA978″,
dataPoints: result3
},
]
});chart.render();
});
});
</script>
</head>
<body><div id=”MainContent”>
<div class=”sub_contents”>
<h8>Number of Facility Book Pie Chart</h8>
<div id=”BarChart” style=”height: 300px; width: 100%; float: right;”></div>
</div></div>
</body>
February 5, 2016 at 11:59 am #9849Can you kindly provide us sample JSON, so that we can look into it and check the issue?
Please refer to this gallery page for an example on rendering chart with data from database. Also refer to this thread for more information on the same.
—
Vishwas R
Team CanvasJS
You must be logged in to reply to this topic.