Login to Ask a Question or Reply
Forum Replies Created by Vishwas R
-
May 5, 2016 at 11:50 am in reply to: Is there a way to increase dpi for higher resolution printing? #10387
[Update]
Print resolution should be handled in ‘Printer Settings’, however you can increase the resolution of image when exported chart as image as shown in this JSFiddle.Jhaagsma,
Sorry for the inconvenience. We are looking into the issue and will get back to you.
David,
As of now controlling the tick and label start point is not available. Interval start point will be calculated automatically and varies for different intervalType. We consider it for future release.
Nefron,
As of now this feature is not available. But you can change color of line once it switches from negative to positive and vice-versa. Here is an example.
Danny,
Thanks for the information. Probably this is the reason why we have not been able to reproduce the issue at our end yet. We will look into it further.
You can define the format of x-value shown in tooltip & indexlabels by setting xValueFormatString. However if you like to completely format / custom-content in the tooltip content, you can use toolTipContent.

—
Vishwas R
Team CanvasJSDanny,
We are glad that you were able to fix the issue. We had seen similar Bug last year in one of the Chrome Updates which they fixed after sometime. Seems like the same/similar issue has reappeared in current version of Chrome. Hoping that they’ll resolve this issue soon. We’ll also try to reproduce this problem at our end in a normal canvas and report the same to Chromium team.
Fernando,
Differences in font rendering between browsers is most probably the culprit here. We’ll try to use more consistent fonts going forward.
Also, the Firefox doesn’t render text properly at certain angles like -20. In those cases you can change it to -30 to make it work properly. Here is how it looks at -30.
Tomi,
We just release v1.8.1 Beta, label-clipping issue has been resolved.In the JSFiddle that you have shared, we observe that you are not providing x-values, because of which the date starts from Jan 1 1970 – as x-values are auto-assigned as 1,2,3,… internally. As the axis is dateTime axis, we suggest you to use intervalType along with interval to set the interval but to pass x-values.
Here is the working fiddle with formatted-labels in “DD/MM/YYYY” format.

—
Vishwas R
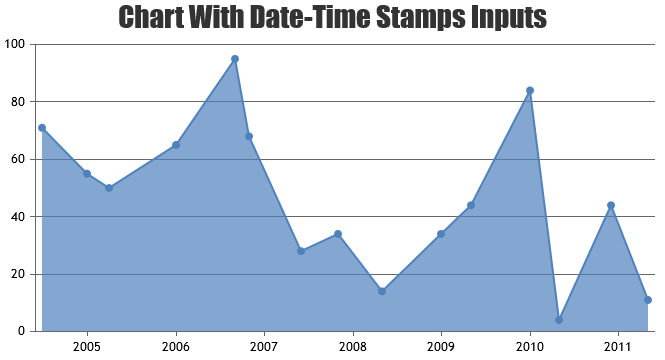
Team CanvasJSIn the JSFiddle that you have shared, we observe that the ISO-format for date-time that you are using is not proper [Correct Format – new Date(“YYYY-MM-DDTHH:MM:SS”)]. Also the csv file is missing, because of which we are unable debug / understand the use-case properly. Passing proper date-time values should work fine in your case. Please refer this documentation page for more information on using date-time values. Please take a look at this JSFiddle for an example on using date-time values.

—
Vishwas R
Team CanvasJS