Login to Ask a Question or Reply
Forum Replies Created by Suyash Singh
-
@ray,
Thanks for the suggestion. As of now, this feature is not inline with our current roadmap.
___
Suyash Singh
Team CanvasJS@ray,
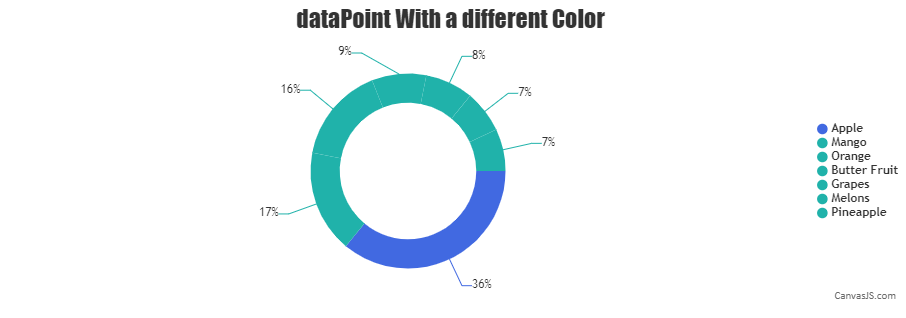
You can add color to each dataPoint(i.e. bar or column) by using the color property.
Yes, we do support Apple devices. Can you please tell us more about the issue you are facing along with device, browser, and OS details?
Sorry, it’s not possible to remove the reserved spacing as of now.

___
Suyash Singh
Team CanvasJSApril 5, 2017 at 12:21 pm in reply to: Change both space between candles and line thickness in Candlestick charts #14764Sorry, as of now you cannot keep space between the candles and still increase the line thickness.
___
Suyash Singh
Team CanvasJSYou can set highlightEnabled to false at dataSeries or dataPoint level to disable highlighting of the dataPoints. And for setting the opacity you can use fillOpacity at dataSeries level or rgba value with color at dataSeries or dataPoint level.
___
Suyash Singh
Team CanvasJS@ray,
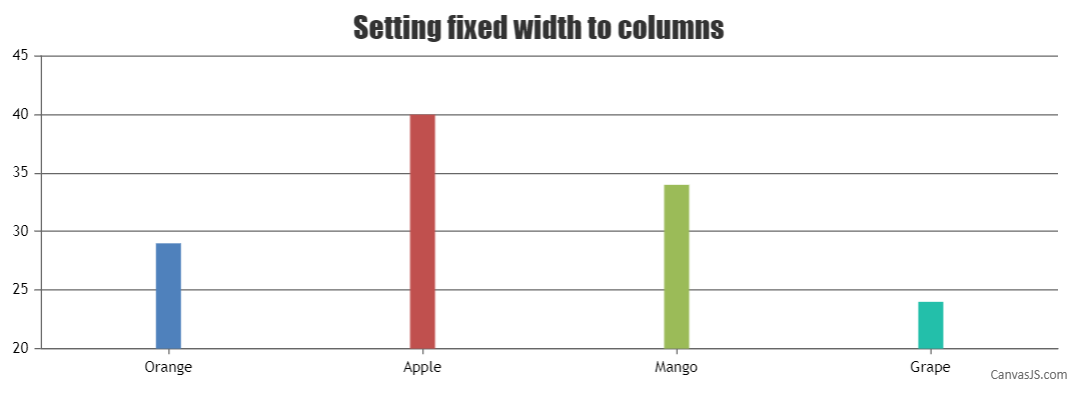
This is the intended behavior, the space is being reserved for corresponding dataPoints from different dataSeries. As of now dataPointWidth is available only at chart level.

___
Suyash Singh
Team CanvasJSIt is not possible to clone the entire chart with events using clone method. Please refer this stackoverflow thread for more info. However you can try to render another chart on the modal with same chart options. Please take a look at the code snippet for creating multiple chart with same chart options.
var chartOptions = {
  title: {
    text: "Chart 1"
  },
  data: [{
    type: "spline",
    dataPoints: [
      { x: 10, y: 71 },
      { x: 20, y: 55 },
      { x: 30, y: 50 },
      { x: 40, y: 65 },
      { x: 50, y: 95 },
      { x: 60, y: 68 },
      { x: 70, y: 28 },
      { x: 80, y: 34 },
      { x: 90, y: 14 }
    ]
  }]
};

var chart1 = new CanvasJS.Chart("chartContainer1", chartOptions);
var chart2 = new CanvasJS.Chart("chartContainer2", chartOptions);
Also, check this JSFiddle for complete working code.

___
Suyash Singh
Team CanvasJS@ray,
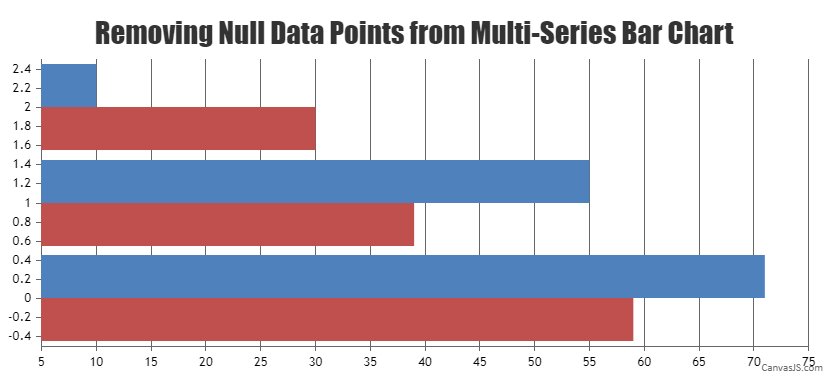
You can remove the dataPoints with null value as shown in the code snippet below –
for(var i = 0; i < chart.options.data.length; i++) {
  for(var j = 0; j < chart.options.data[i].dataPoints.length; j++) {
    if(chart.options.data[i].dataPoints[j].y === null)
      chart.options.data[i].dataPoints.splice(j, 1);
  }
}
Please take a look at this JSFiddle for a working example.

___
Suyash Singh
Team CanvasJSJannick,
Please refer this tutorial on Creating Charts from CSV.
___
Suyash Singh
Team CanvasJSYou can use contentFormatter to achieve this. Please refer this jsfiddle.
___
Suyash Singh
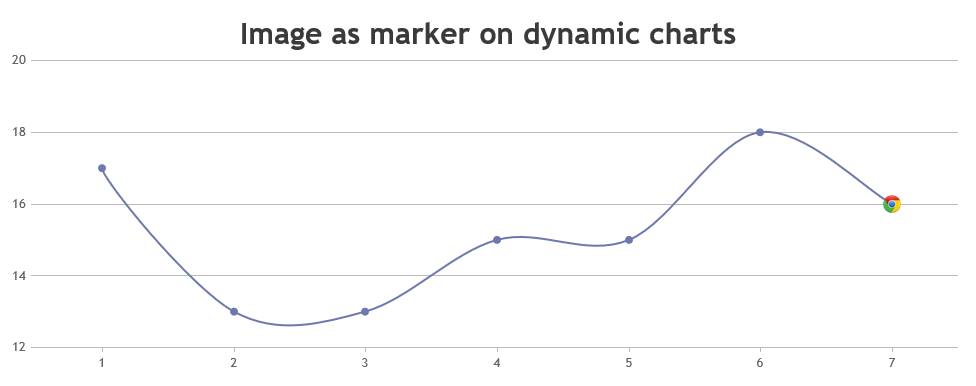
Team CanvasJS1. Default Markers are automatically disabled when number of dataPoints are more. You can manually override the automatic disabling/enabling of markers by setting markerSize to a value equal to or greater than zero.
{
  .
  .
  data: [{
    markerSize: 10,
    .
    .
  }]
}
Please have a look at this JSFiddle for complete code.
2. You can show the marker image only for current dataPoint by placing the marker Image on top of the last dataPoint every time the chart is updated. Please have a look at this below code snippet for the same.
var updateChart = function () {
  yVal = yVal + Math.round(5 + Math.random() * (-5 - 5));
  dps.push({ x: xVal,y: yVal });
  xVal++;
  if (dps.length > 10)
  {
    dps.shift();
  }
  chart.render();

  // Position image marker over the last/ current dataPoint
  positionMarkerImage(imageMarker, chart.options.data[0].dataPoints.length - 1);
};

function positionMarkerImage(imageMarker, index){
  var pixelX = chart.axisX[0].convertValueToPixel(chart.options.data[0].dataPoints[index].x);
  var pixelY = chart.axisY[0].convertValueToPixel(chart.options.data[0].dataPoints[index].y);

  imageMarker.css({"position": "absolute",
                   "display": "block",
                   "top": pixelY - imageMarker.height()/2,
                   "left": pixelX - imageMarker.width()/2
                  });
}

var updateId = setInterval(function () { updateChart();}, updateInterval);
Please refer to this JSFiddle for complete code on the same.

___
Suyash Singh
Team CanvasJSIt seems like you got confused between indexLabelFontStyle and indexLabelFontFamily, please refer the documentation for more info. Also check this updated jsfiddle.
—
Suyash Singh
Team CanvasJSSorry, we were unable to reproduce the issue regarding change in the size of indexLabel at our end. Can you please create a jsfiddle reproducing the issue and also share browser and OS details along with versions where you are facing this issue.
Regarding your query about placing indexLabels at the bottom, this feature is not available out of the box as of now. However you can follow this workaround.
___
Suyash Singh
Team CanvasJSThank you for your interest in CanvasJS. We do have dashboard examples for download. Please have a look.
___
Suyash Singh
Team CanvasJSYou can hide the axisX line by setting the lineThickness property to zero. Please check this jsfiddle.
___
Suyash Singh
Team CanvasJS