Login to Ask a Question or Reply
You must be logged in to post your query.
Home › Forums › Chart Support › Set image as a marker
Set image as a marker
- This topic has 12 replies, 2 voices, and was last updated 9 years, 3 months ago by
Suyash Singh.
Tagged: dynamic data, image, marker, splinegrapgh
-
March 22, 2017 at 11:57 am #14640
Hello, i wanted to know that can we set an image as a marker. i am using splineGraph and i want to
-
replace the circle marker with an image
. Please reply as soon as possible.
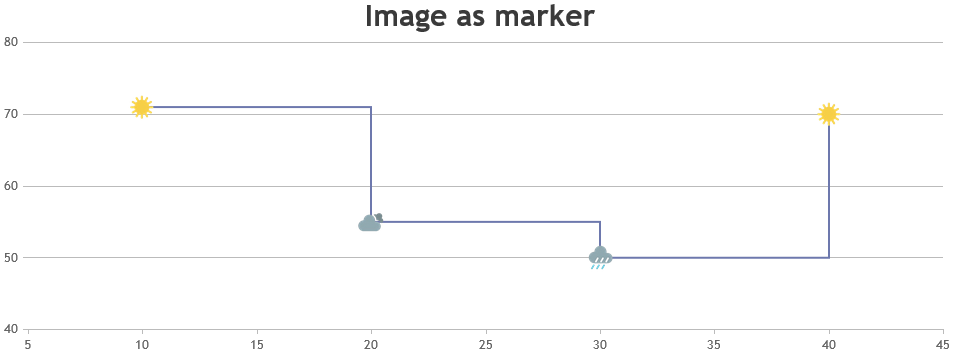
March 22, 2017 at 5:56 pm #14645As of now markers can have only five possible values – “circle”, “square”, “triangle” , “cross” & “none”. However, you can position images in place of markers by adding few lines of code. Please checkout the code snippet below for the same.
addMarkerImages(chart);

function addMarkerImages(chart){
  for(var i = 0; i < chart.data[0].dataPoints.length; i++){
    customMarkers.push($("<img>").attr("src", chart.data[0].dataPoints[i].markerImageUrl)
                       .css("display", "none")
                       .css("height", 30)
                       .css("width", 30)
                       .appendTo($("#chartContainer>.canvasjs-chart-container"))
                      );
    positionMarkerImage(customMarkers[i], i);
  }
}

function positionMarkerImage(customMarker, index){
  var pixelX = chart.axisX[0].convertValueToPixel(chart.options.data[0].dataPoints[index].x);
  var pixelY = chart.axisY[0].convertValueToPixel(chart.options.data[0].dataPoints[index].y);

  customMarker.css({"position": "absolute",
                    "display": "block",
                    "top": pixelY - customMarker.height()/2,
                    "left": pixelX - customMarker.width()/2
                   });
}
Also, please take a look at this JSFiddle for a complete code. For further insight, please refer this how to section for positioning images over chart.
—
Suyash Singh
Team CanvasJSMarch 22, 2017 at 10:33 pm #14647Hello @Suyash Singh, Thanks a lot for the quick response..
This works perfectly….
you guys have done a superb job..
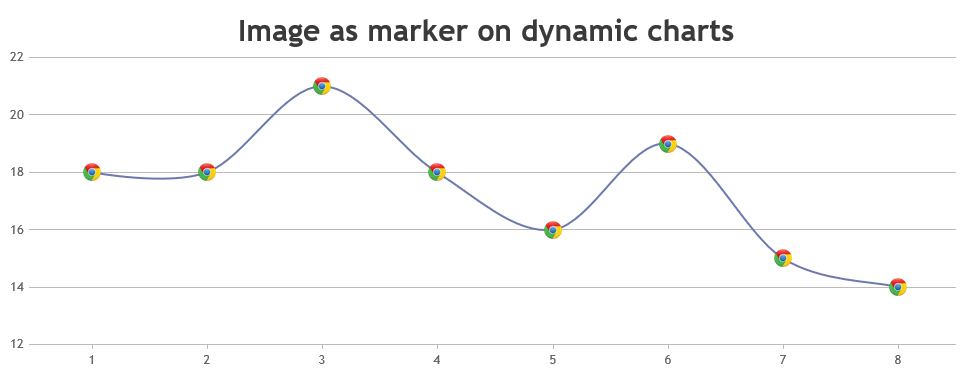
This saved me a lot of time..March 22, 2017 at 11:13 pm #14648<!DOCTYPE HTML> <html> <head> <style> img{ pointer-events: none; } </style> <script type="text/javascript" src="https://canvasjs.com/assets/script/jquery-1.11.1.min.js"></script> <script type="text/javascript" src="https://cdn.canvasjs.com/jquery.canvasjs.min.js"></script> <script type="text/javascript"> window.onload = function () { var dps = [{x: 0, y: 0, markerImageUrl: "http://i.imgur.com/TUmQf5n.png"}]; /*[{x: 1, y: 10, markerImageUrl: "http://i.imgur.com/TUmQf5n.png"}, {x: 2, y: 13, markerImageUrl: "http://i.imgur.com/TUmQf5n.png"}, {x: 3, y: 18, markerImageUrl: "http://i.imgur.com/TUmQf5n.png"}, {x: 4, y: 20, markerImageUrl: "http://i.imgur.com/TUmQf5n.png"}, {x: 5, y: 17, markerImageUrl: "http://i.imgur.com/TUmQf5n.png"}, {x: 6, y: 10, markerImageUrl: "http://i.imgur.com/TUmQf5n.png"}, {x: 7, y: 13, markerImageUrl: "http://i.imgur.com/TUmQf5n.png"}, {x: 8, y: 18, markerImageUrl: "http://i.imgur.com/TUmQf5n.png"}, {x: 9, y: 20, markerImageUrl: "http://i.imgur.com/TUmQf5n.png"}, {x: 10, y: 47, markerImageUrl: "http://i.imgur.com/TUmQf5n.png"}]; */ //dataPoints. var chart = new CanvasJS.Chart("chartContainer", { theme: "theme2", //theme1 backgroundColor: "transparent", title: { text: "Live Data" }, axisX: { title: "Velocity" }, axisY: { title: "Distance" }, data: [ { type: "spline", markerType: "none", dataPoints: dps } ] }); chart.render(); var xVal = dps.length + 1; var yVal = 15; var updateInterval = 1000; var updateChart = function () { yVal = yVal + Math.round(5 + Math.random() * (-5 - 5)); dps.push({x: xVal,y: yVal, markerImageUrl: "http://i.imgur.com/TUmQf5n.png"}); xVal++; if (dps.length > 10) { dps.shift(); } chart.render(); // update chart after specified time. }; setInterval(function () { updateChart(); }, updateInterval); var customMarkers = []; addMarkerImages(chart); function addMarkerImages(chart) { for (var i = 0; i < chart.data[0].dataPoints.length; i++) { customMarkers.push($("<img>").attr("src", chart.data[0].dataPoints[i].markerImageUrl) .css("display", "none") .css("height", 40) .css("width", 50) .appendTo($("#chartContainer>.canvasjs-chart-container")) ); positionMarkerImage(customMarkers[i], i); } } function positionMarkerImage(customMarker, index) { var pixelX = chart.axisX[0].convertValueToPixel(chart.options.data[0].dataPoints[index].x); var pixelY = chart.axisY[0].convertValueToPixel(chart.options.data[0].dataPoints[index].y); customMarker.css({"position": "absolute", "display": "block", "top": pixelY - customMarker.height() / 2, "left": pixelX - customMarker.width() / 2 }); } $(window).resize(function () { for (var i = 0; i < chart.data[0].dataPoints.length; i++) { positionMarkerImage(customMarkers[i], i); } }); }; </script> </head> <body> <div id="chartContainer" style="height: 300px; width: 100%;"></div> </body> </html>This is what i have done so far. For static data it is working fine, when i am trying to do it for dynamic data, don’t now why the dps.push function is not working. The graph is created but the image doesn’t appears. Please suggest what is wrong here. i am almost there.
-
This reply was modified 9 years, 4 months ago by
NehaSingh. Reason: remove Extra code for better understanding
March 23, 2017 at 1:49 am #14651And I also wanted to ask that I am using this for a college project and it is offline. I just read that trial version is only for 30 days so will I be able to use this after that???
Can I use it offline… or it will stop working after the trial period.March 23, 2017 at 8:32 pm #14660For dynamic data, updating the position of image after adding new dataPoint has to be handled. Please take a look at below code snippet for the same.
var updateChart = function () {
  yVal = yVal + Math.round(5 + Math.random() * (-5 - 5));
  dps.push({ x: xVal,y: yVal });
  xVal++;
  if (dps.length > 10)
  {
    dps.shift();
  }
  chart.render();
  addMarkerImage(chart);
};

function addMarkerImage(chart) {
  var data = chart.options.data[0];
  for(var i = 0; i < data.dataPoints.length; i++) {
    customMarkers.push($("<img>").attr("src", data.markerImageUrl)
                       .css("display", "none")
                       .css("height", 20)
                       .css("width", 20)
                       .appendTo($("#chartContainer>.canvasjs-chart-container"))
                      );
    positionMarkerImage(customMarkers[i], i);
  }
}

function positionMarkerImage(customMarker, index){
  var pixelX = chart.axisX[0].convertValueToPixel(chart.options.data[0].dataPoints[index].x);
  var pixelY = chart.axisY[0].convertValueToPixel(chart.options.data[0].dataPoints[index].y);

  customMarker.css({"position": "absolute",
                    "display": "block",
                    "top": pixelY - customMarker.height()/2,
                    "left": pixelX - customMarker.width()/2
                   });
}

var updateId = setInterval(function () { updateChart();}, updateInterval);
Please refer to this JSFiddle for complete code.
Regarding your query about the Trial Version, our sales team have already mailed you and they will be assisting you further with your requirements.
—
Suyash Singh
Team CanvasJSApril 3, 2017 at 12:40 pm #14725Hello,
I am going through few problems.
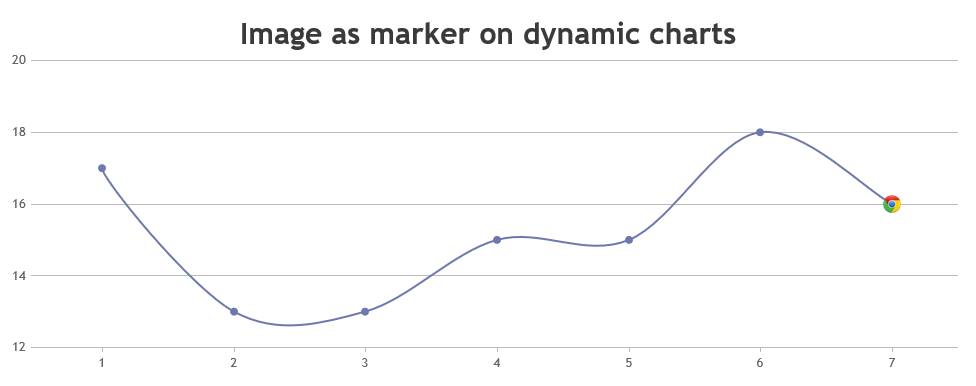
1. I am showing live data from my database which is being updated every 2 seconds. Now after some time the marker disappears. For first few minutes it is displayed but not after that, is there any range? the line works fine. only i am not able to see the marker.2. i am using an image as a marker but i want to show the image only for the current position and the rest of the points should be any simple marker type. Is there any way to do that?
Hoping to hear from you soon.
April 3, 2017 at 4:35 pm #147261. Default Markers are automatically disabled when number of dataPoints are more. You can manually override the automatic disabling/enabling of markers by setting markerSize to a value equal to or greater than zero.
{
  .
  .
  data: [{
    markerSize: 10,
    .
    .
  }]
}
Please have a look at this JSFiddle for complete code.
2. You can show the marker image only for current dataPoint by placing the marker Image on top of the last dataPoint every time the chart is updated. Please have a look at this below code snippet for the same.
var updateChart = function () {
  yVal = yVal + Math.round(5 + Math.random() * (-5 - 5));
  dps.push({ x: xVal,y: yVal });
  xVal++;
  if (dps.length > 10)
  {
    dps.shift();
  }
  chart.render();

  // Position image marker over the last/ current dataPoint
  positionMarkerImage(imageMarker, chart.options.data[0].dataPoints.length - 1);
};

function positionMarkerImage(imageMarker, index){
  var pixelX = chart.axisX[0].convertValueToPixel(chart.options.data[0].dataPoints[index].x);
  var pixelY = chart.axisY[0].convertValueToPixel(chart.options.data[0].dataPoints[index].y);

  imageMarker.css({"position": "absolute",
                   "display": "block",
                   "top": pixelY - imageMarker.height()/2,
                   "left": pixelX - imageMarker.width()/2
                  });
}

var updateId = setInterval(function () { updateChart();}, updateInterval);
Please refer to this JSFiddle for complete code on the same.
___
Suyash Singh
Team CanvasJS -
This reply was modified 9 years, 4 months ago by
Tagged: dynamic data, image, marker, splinegrapgh
You must be logged in to reply to this topic.