Login to Ask a Question or Reply
Forum Replies Created by Shashi Ranjan
-
From the CanvasJS v1.8 to CanvasJS v2.3.1 we have added many new features to the library because of which the performance may vary by only a few milliseconds.
However, if you can create a JSFiddle reproducing the issue you are facing and share it with us we will look into the code, understand the scenario better and help you out.
____
Shashi Ranjan
Team CanvasJSThis behavior is designed such that zooming is limited up to a certain region, so the user doesn’t end up zooming into a blank-region (a region with no dataPoints). To zoom into a certain region, there should be a minimum of 3-4 dataPoints.
In your case, the zoom doesn’t work as there are less than 3-4 dataPoints over the Axis Y but by changing the zoomType to “x” it would work as there are more than 3-4 dataPoints over the Axis X.
____
Shashi Ranjan
Team CanvasJSjQuery.getJSON is asynchronous method due to which your chart gets rendered before the array
arr_datagets populated. Hence by performing jQuery.getJSON() method inside jQuery.when() method and then calling chart.render() inside the .then() method will work fine in your case as shown in this JSFiddle.____
Shashi Ranjan
Team CanvasJSMarch 8, 2019 at 7:23 pm in reply to: How to set position indexLabel Stackbar100 outside in top or bottom stackbar #24589Can you please share the sample project along with the sample data over Google Drive/One Drive with a brief explanation of your requirement so that we can understand your use-case better and help you out.
____
Shashi Ranjan
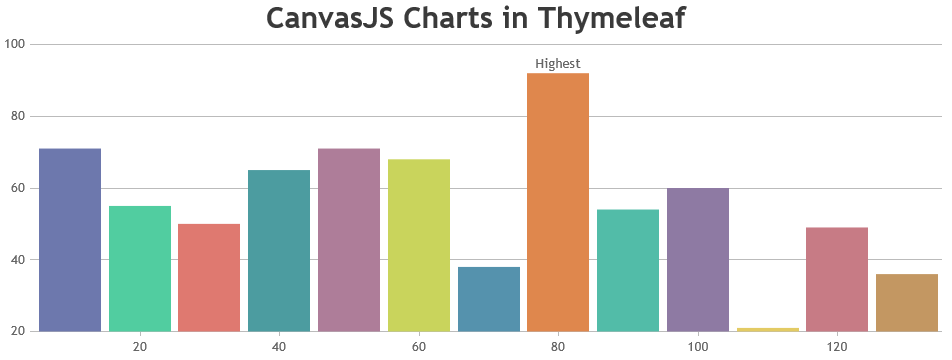
Team CanvasJSCanvasJS can be integrated with Spring MVC irrespective of the view layer being used in the project. When it comes to the view layer in Spring MVC, it gives you a variety of choices like JSP or template engines like Thymeleaf, Velocity, FreeMarker, etc.
The Spring MVC sample that you can download from our download page uses JSP as view, whereas CanvasJS works smoothly without any issue with any template engines – as CanvasJS is just a JavaScript library, it works fine as the browser supports JavaScript irrespective of any template engine being used.
Here is a sample project of integrating CanvasJS in Spring MVC web-project that uses Thymeleaf template engine as view layer.
—
Shashi Ranjan
Team CanvasJSCan you please let us know which specific component of the chart you would like to be draggable such as dataPoints, chart container(div) etc. so that we can understand your exact use case and help you out with an appropriate solution.
____
Shashi Ranjan
Team CanvasJSMarch 5, 2019 at 9:56 pm in reply to: how do i achieve displaying graphs by weeks based on date? #24555CanvasJS just renders charts based on the data that you pass in the chart-options. You can modify your MySQL query to get data based on weeks and pass it to chart to show weekly data.
____
Shashi Ranjan
Team CanvasJSYou can create a drilldown chart by changing the dataPoints of the chart when a dataSeries is clicked. Please take a look at this JSFiddle for an example on the same.
____
Shashi Ranjan
Team CanvasJSFor rendering chart based on user input please refer to this documentation page.
____
Shashi Ranjan
Team CanvasJSWe have added this feature in our wishlist but there is no definite timeline yet regarding its release.
____
Shashi Ranjan
Team CanvasJSThe occurrence of the above-mentioned scenario is due to the fact that there is no space available on the top of the DataPoints to display the indexLabel. To overcome this you can increase the Axis Y maximum to a certain value so that there is enough space available at the top for the indexLabel to be displayed as shown in this updated JSFiddle.
I don’t see a property that allows you to center align the dataPoints labels along the X axis. Is this possible?
Sorry, this feature is not available as of now.
____
Shashi Ranjan
Team CanvasJSbevelEnabled seems to be working fine on all type of column and bar charts at our end. Can you please create a JSFiddle reproducing the issue you’re facing so that we can look into it, understand the scenario and help you out.
____
Shashi Ranjan
Team CanvasJS