Login to Ask a Question or Reply
Forum Replies Created by Sachin Bisht
-
There seems to be an issue with respect to this use-case while setting interval to 1. We will investigate it further and fix it in future versions.
__
Sachin Bisht
Team CanvasJSBased on the range of y-axis the chart is rendering too many labels which is causing the browser to freeze. Setting interval seems to work fine in this case. You can customize the format of axis labels to show in exponential format by setting valueFormatStringproperty to “0E0”. Kindly have a look at this updated JSFiddle for the working example on the same.
__
Sachin Bisht
Team CanvasJSAdding
commonjsOptions: { transformMixedEsModules: true }to the build option of Vite config should fix this issue. Please refer to this Stack Overflow thread for more information about the same.__
Sachin Bisht
Team CanvasJSAdding
commonjsOptions: { transformMixedEsModules: true }to the build option of Vite config should fix this issue. Please refer to this Stack Overflow thread for more information about the same.__
Sachin Bisht
Team CanvasJSKaushik Chaudhary,
Stripline label orientation is not available as of now. However it can be achieved by adding dummy scatter dataSeries with indexLabel. Please take a look at this JSFiddle for an example on the same.
You can bind click even to stripline with the help of it’s bounds. Please take a look at this JSFiddle for an example on the same.
__
Sachin Bisht
Team CanvasJSUpdating the parsing logic according to your CSV data should work fine in this case. Kindly have a look at updated JSFiddle of the same.
—
Sachin Bisht
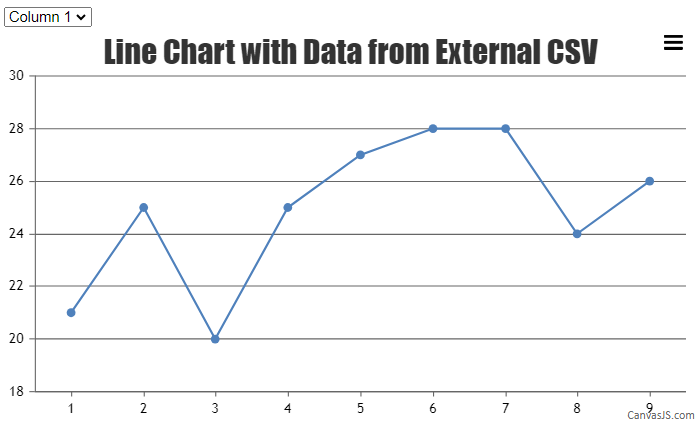
Team CanvasJSTo render chart with data from selected column of CSV file, you can populate the dropdown with all the columns present in the CSV file & update chart data based on selected option. Please take a look at this JSFiddle for an example of the same.

__
Sachin Bisht
Team CanvasJSWe have released chart v3.8.2 with the above fix. Please refer to the release blog for more information. Do download the latest version from our download page and let us know your feedback.
__
Sachin Bisht
Team CanvasJSApril 8, 2024 at 6:36 pm in reply to: Custom Export Button Text Becomes Undefined When Using useEffect #44924The text was getting changed to ‘undefined’ due to some internal code, which we have fixed in the current release. Please refer to this blog post for more information on the current release. Also, take a look at this updated updated StackBlitz for working code.
Sachin Bisht
Team CanvasJSApril 5, 2024 at 11:15 am in reply to: Custom Export Button Text Becomes Undefined When Using useEffect #44910We are looking into your query and will get back to you at the earliest.
__
Sachin Bisht
Team CanvasJSMarch 29, 2024 at 7:56 pm in reply to: Custom Export Button Text Becomes Undefined When Using useEffect #44870Updating the text to ‘Save as CSV’ after rendering the chart seems to be working in this case. Please take a look at this updated Stackblitz.
—
Sachin Bisht
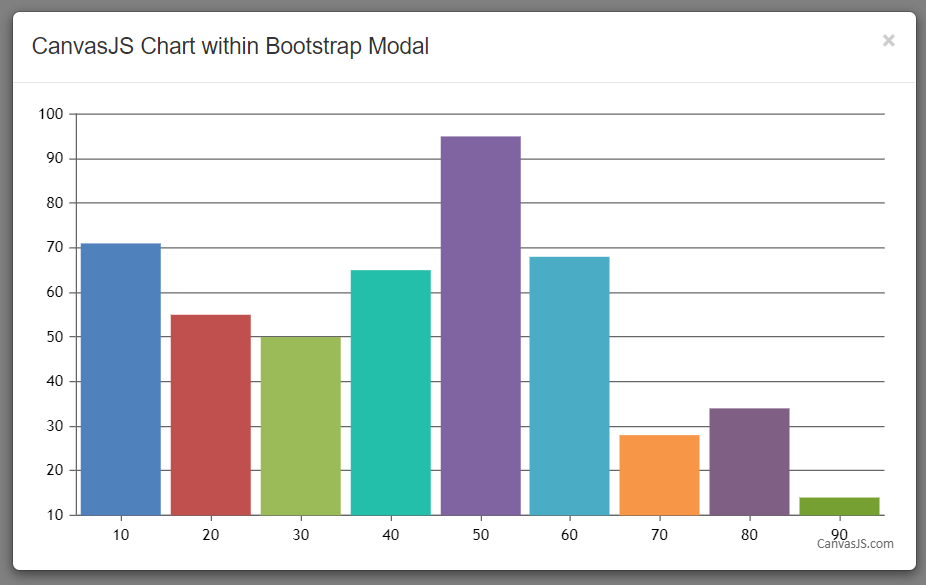
Team CanvasJSCanvasJS Chart automatically sets the width and height of the chart according to container’s dimensions. When the container’s dimension is not specified it takes up the default width & height(500px X 400px).
Also, in bootstrap, since the modal is not displayed initially, chart takes the default values. To solve this issue, you can render the chart when the shown.bs.modal event is fired.
$('#chartModal').on('shown.bs.modal', function () {
        chart.render();
});
Please take a look at this JSFiddle.
Sachin Bisht
Team CanvasJSThanks for reporting the use case. The error appears as you are trying to update the tooltip for the series that’s not present, as it is being removed and added after every 200ms. We will look into this case further to handle dynamic updates properly in future releases. In the meantime, you can try rendering the chart after adding the data series. Please take a look at the updated JSFiddle for an example on the same.
__
Sachin Bisht
Team CanvasJSFebruary 13, 2024 at 12:24 am in reply to: How do I refresh the graphic when the screen changes? #44656