Login to Ask a Question or Reply
You must be logged in to post your query.
Home › Forums › Chart Support › Charts with drop down button to filter
Charts with drop down button to filter
- This topic has 24 replies, 10 voices, and was last updated 2 years, 3 months ago by
Sachin Bisht.
Tagged: chart filter, drop-down menu
-
March 27, 2020 at 4:10 pm #28763
Chart animates only on the first/initial render, as of now. To animate at every subsequent selection, you can destroy and re-create the chart as shown in the code snippet below –
$( ".dropdown" ).change(function() {
  chart.destroy();
  chart = new CanvasJS.Chart("chartContainer",chartOptions);
  chart.options.data[0].dataPoints = [];
  selectDataSeries();
});

function selectDataSeries(){
  var selected = element.options[element.selectedIndex].value;
  dps = jsonData[selected];
  for(var i in dps) {
    var xVal = dps[i].x;
    chart.options.data[0].dataPoints.push({x: new Date(xVal), y: dps[i].y});
  }
  chart.render();
}
Please take a look at this JSFiddle for a working example.
___________
Indranil Deo
Team CanvasJSMarch 27, 2020 at 10:03 pm #28770Really appreciate your guidance here Indranil!
March 23, 2021 at 7:32 am #33624Can anyone help me in displaying the different chart selected from dropdown menu using angular?
March 24, 2021 at 6:36 pm #33676To modify a chart based on dropdown selection you need to update the chart options / data according to the options selected from the dropdown list using the ngModelChange event. Please check the code snippet below –
HTML
<select [(ngModel)]="selectedValue" (ngModelChange)='onChange($event)'>
  <option *ngFor="let option of options" [value]="option.id">
    {{option.name}}
  </option>
</select>
TS
onChange(val:any){
  let dps = this.jsonData[val];
  this.chart.options.data[0].dataPoints = dps;
  this.chart.render();
}
Also, kindly take a look at this StackBlitz for a working example.
___________
Indranil Deo
Team CanvasJSApril 15, 2024 at 10:37 am #44958Hi, wondering if its possible to get assistance.
Im trying to get the data source to be a csv file, and the dropdown to be different fields in the csv file.
I can pull a CSV file in, but i dont understand how to map the csv fields dynamically to ta dropdown to populate the chart.options.data[0].dataPoints
Ive attached parts of the code here:
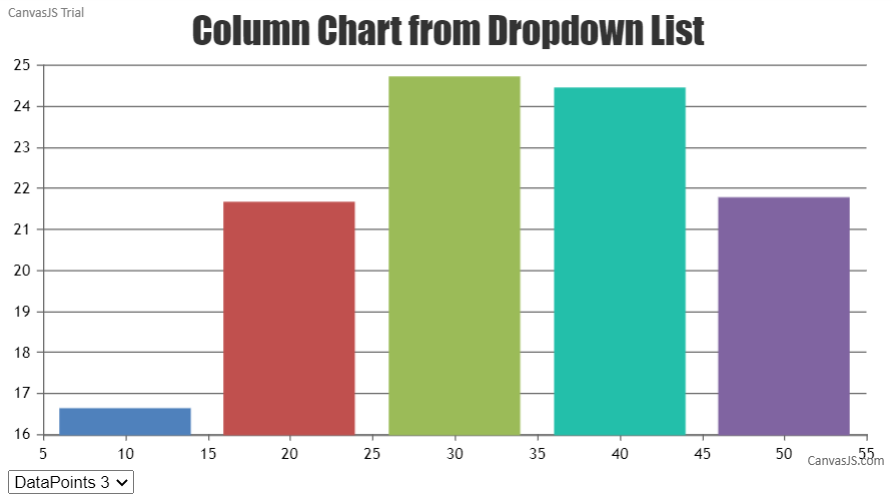
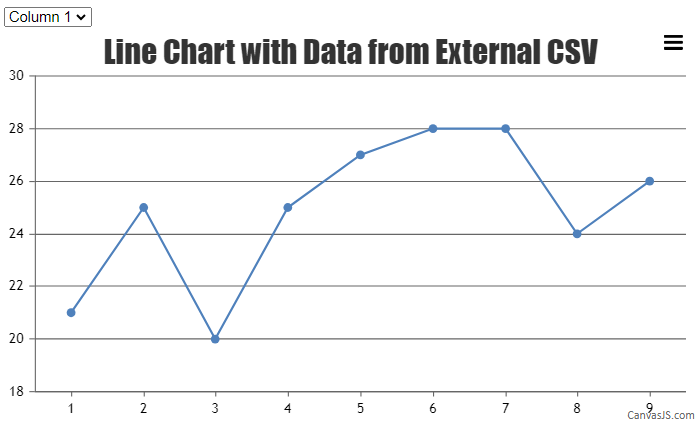
April 16, 2024 at 6:52 pm #44979To render chart with data from selected column of CSV file, you can populate the dropdown with all the columns present in the CSV file & update chart data based on selected option. Please take a look at this JSFiddle for an example of the same.
__
Sachin Bisht
Team CanvasJSApril 17, 2024 at 11:42 am #44985awesome, that seems to have solved my issue. Thank you
April 17, 2024 at 2:39 pm #44987Ive run into another issue, My CSV data looks like this:
CALLUUID CALLSEQUENCENO CALLSTATE CALLINGPARTY CALLEDPARTY CALLSTARTTIME CALLANSWERTIME CALLENDTIME CALLDURATION CALLBILLABLEDURATION CALLANSWERDELAY CALLALERTINGDELAY
fa7a2fc-84c3-4a65-842f-3de3b5a1fb77 1 HANGUP 11272022440 11285292205 1713344742506 1713344742506 1713344742506 5.748 4.299 1.449 0How do i get the column labels to match the top row, and also i dont see any data from the 2nd row onwards in my graph?
It works when i use your CSV in the example, but not with mine?
It does calculate that there are 11 columns though.
April 18, 2024 at 10:30 am #44996EDIT… The true CSV looks like this:
CALLUUID,CALLSEQUENCENO,CALLSTATE,CALLINGPARTY,CALLEDPARTY,CALLSTARTTIME,CALLANSWERTIME,CALLENDTIME,CALLDURATION,CALLBILLABLEDURATION,CALLANSWERDELAY,CALLALERTINGDELAY
afa7a2fc-84c3-4a65-842f-3de3b5a1fb77,1,HANGUP,+12272011111,+11285291111,1713344742506,1713344743955,1713344748254,5.748,4.299,1.449,0
bed9efb8-9aae-4e5b-b1a7-914086894be4,2,HANGUP,+12272571111,+11285291111,1713344743008,1713344744199,1713344749256,6.248,5.057,1.191,0Im trying to get the dropdown to show the toprow as options, and the X Axis to show Column 1, and the Y axis to flip between columns 2-11.
Is this even possible?
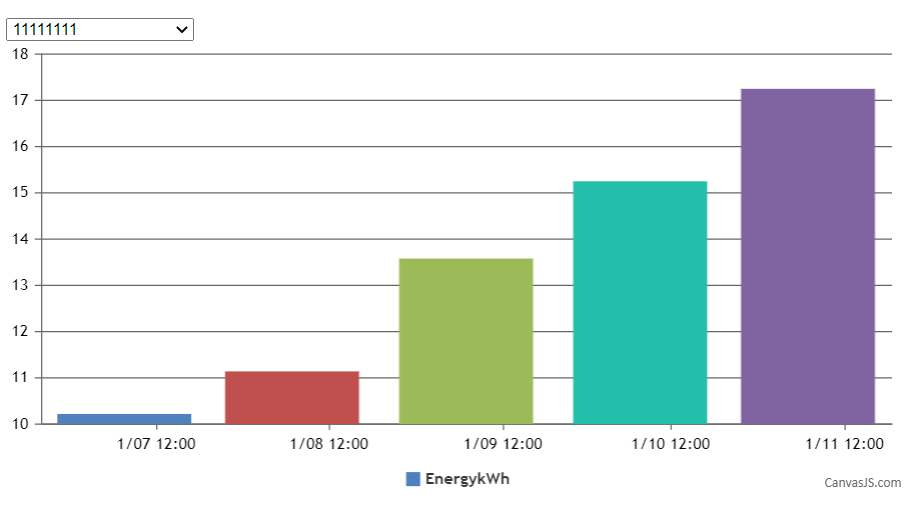
April 19, 2024 at 7:19 pm #45001Updating the parsing logic according to your CSV data should work fine in this case. Kindly have a look at updated JSFiddle of the same.
—
Sachin Bisht
Team CanvasJS
Tagged: chart filter, drop-down menu
You must be logged in to reply to this topic.