Login to Ask a Question or Reply
Forum Replies Created by Sachin Bisht
-
Charts seems to be working fine & we are unable to reproduce the issue that you have mentioned above. Can you kindly create sample project and share it with us over Google-Drive or Onedrive so that we can run it locally at our end, understand the scenario better and help you out?
__
Sachin Bisht
Team CanvasJSControl over starting point of axis labels is not available as of now. You can work around this by removing the default axis labels & gridlines along with adding stripLines to show them at an interval of 2.
Please take a look at this JSFiddle for a working example of the same.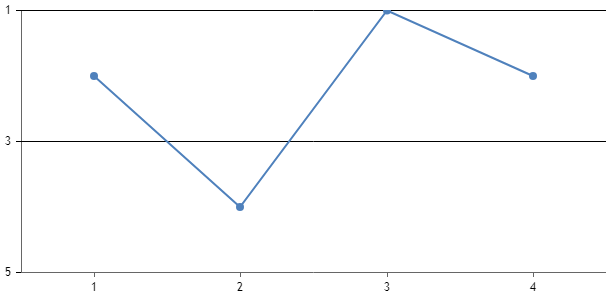
__
Sachin Bisht
Team CanvasJS-
This reply was modified 1 year, 11 months ago by
Sachin Bisht.
We have released chart v3.10.4 with the above fix. Please refer to the release blog for more information. Do download the latest version from our download page and let us know your feedback.
__
Sachin Bisht
Team CanvasJSTo hide the axis line and tick you can set the lineThickness and tickLength to 0, as shown in the code snippet below.
axisY: {
  tickLength: 0,
  lineThickness: 0,
  labelFormatter: function(){
     return " ";
  }
}
Also, kindly take a look at this JSFiddle for a working sample of the same.
__
Sachin Bisht
Team CanvasJSThanks for reporting the use case. This looks like a bug & we will fix it in the future releases. Meanwhile, you can work around this by setting a relatively smaller y-value to the datapoint instead of setting it to 0 as shown in the code-snippet below..
{ x: 10, y: 0.2, indexLabel: "0", toolTipContent: "{x}: 0", highlightEnabled: false, /* color: "transparent" */}Please take a look at this updated JSFiddle for the working example of the same.
__
Sachin Bisht
Team CanvasJSThe behavior is by design so that zooming is limited upto a certain region, so that user doesn’t end up zooming into a blank-region (region with no dataPoints). To zoom into a certain region, there should be a minimum of 3-4 dataPoints over the axis.
When zoomType is either set to ‘x’ or ‘y’, it checks for number of datapoints over specific axis. But when zoomType is ‘xy’ it checks for the datapoints within the selected region over both the axes because of which it gets invalidated in certain cases.
__
Sachin Bisht
Team CanvasJSThanks for reporting the use case. It looks like a bug, we will look into this in future releases. Setting axis-Y range using minimum and maximum according to your data, seem to be working fine as shown in the code snippet below,
axisY: {
    minimum: -0.09,
    maximum: -0.01
}
Please take a look at the updated JSFiddle for an working example on the same.
__
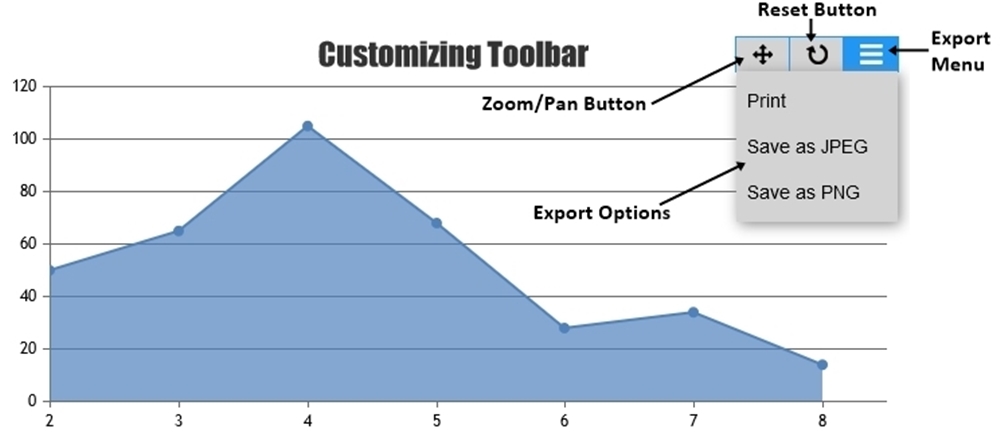
Sachin Bisht
Team CanvasJSYou can customize the look and feel of toolbar by changing toolbar options like buttonBorderColor, itemBackgroundColor, fontColor, etc. Please refer to this documentation page for complete list of customization options available. Changing icons is not available as an inbuilt feature as of now.
__
Sachin Bisht
Team CanvasJSPlease download the commercial version from My Account Page. Once downloaded, replacing trial version of the script with commercial version (canvasjs.min.js incase of Chart & canvasjs.stock.min.js incase of StockChart) should work fine. We recommend you to clear the browser cache and try refreshing the page after replacing the script.
__
Sachin Bisht
Team CanvasJSKindly take a look at this StackBlitz’s App.svelte file for the integration code.
__
Sachin Bisht
Team CanvasJS-
This reply was modified 2 years, 1 month ago by
May 29, 2024 at 6:10 pm in reply to: setting a value undefined do not display the values (it works for null) #45201Axis maximum supports number, date-time (date object or timestamp) and null values & doesn’t support undefined. When null value is passed, maximum gets reset to default value.
—
Sachin Bisht
Team CanvasJSCanvasJS Charts seems to be working fine with Svelte. Please take a look at this Stackblitz for a working example of the same.
If you are still facing issue, kindly create a sample project reproducing the issue you are facing and share it with us so that we can run it at our end to understand the scenario better and help you out.
__
Sachin Bisht
Team CanvasJSThanks for your feedback. We will look into it in future releases.
__
Sachin Bisht
Team CanvasJSThanks for your feedback. We will look into it in future releases.
__
Sachin Bisht
Team CanvasJS -
This reply was modified 1 year, 11 months ago by