Login to Ask a Question or Reply
Forum Replies Created by Priyanka M S
-
0—–5 >using scroll> to amplify 0—————5, OR to reduce 0–5 .
1- is this posible?Please take a look at this jsfiddle.
2- i’d like to modify or setup the crosshairX tooltip (label or whatever) to make it fixed to the parent’s border. (i’m using this chart inside a div with overflow-y: scroll)
Can you kindly share a jsfiddle or pictorial representation showcasing your requirement, so that we can understand it better and help you out?
__
Priyanka M S
Team CanvasJSTo convert PHP date to JavaScript timestamp, first, you need to convert PHP date to PHP timestamp using strtotime and then convert PHP timestamp to JavaScript timestamp by multiplying PHP timestamp by 1000. Also, you need to set xValueType to ‘dateTime’ as x-value will be in timestamp.
$phpDate = date("Y-m-d h:i:sa");
$phpTimestamp = strtotime($phpDate);
$javaScriptTimestamp = $phpTimestamp * 1000;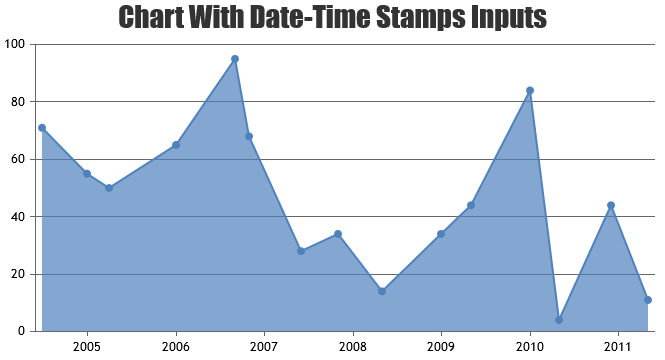
If this doesn’t solve your requirement, kindly share a sample project along with sample database over Google Drive or Onedrive reproducing the issue your are facing, so that we can look into your code, understand it better and help you out.
__
Priyanka M S
Team CanvasJSCanvasJS accepts only numeric or dateTime in x-values and numeric in y-values. Assigning numeric values to time and temperature values of point array
$point = array("time" => $row['time'] , "temperature" => $row['temperature']);, should work fine in your case.If this doesn’t solve your issue, kindly create a sample project reproducing the issue you are facing and share it over Google-Drive or Onedrive along with the sample database, so that we can look into your code, understand it better and help you out.
__
Priyanka M S
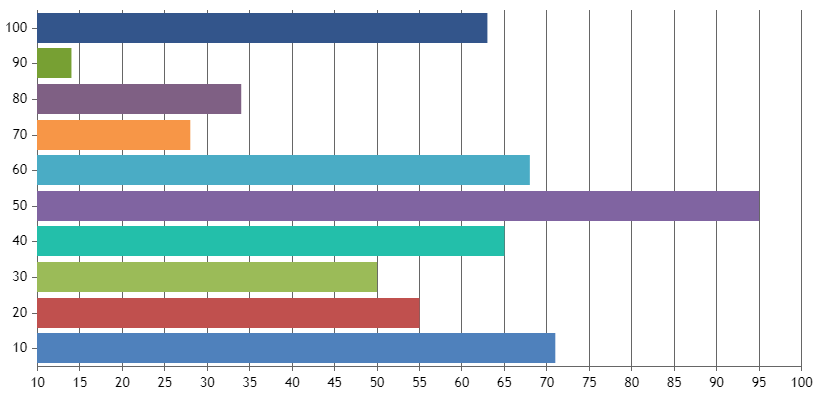
Team CanvasJSBy default, Chart takes the size of its container(if set). So you can just set the width and height of the chart-container in which you are rendering the chart as shown below:
<div id="chartContainer" style="height: 300px; width: 100%;">If you like to change the height of the chart keeping the dataPointWidth as constant, you can update the height of chart as shown in the below code snippet.
function handleChartHeight(chart){
    var dpsWidth = 30;
    var plotAreaHeight = chart.axisX[0].bounds.height;
    var chartHeight = plotAreaHeight + (2.5 * dpsWidth);
    chart.options.dataPointWidth = dpsWidth;
    chart.options.height = chartHeight;
}
Please take a look at this JSFiddle for complete code.
__
Priyanka M S
Team CanvasJSThanks for reporting. We will look into it and will get back to you at the earliest.
__
Priyanka M S
Team CanvasJSOctober 12, 2018 at 10:14 am in reply to: read from csv and display dynamic data for every 2 mins #23027Please take a look at this jsfiddle where chart data is updated every 1 second. You can increase / decrease the update-interval to seconds / minutes according to your requirements.
Considering this to be a duplicate of this thread, hence closing it.
__
Priyanka M S
Team CanvasJSOctober 11, 2018 at 2:58 pm in reply to: read from csv and display dynamic data for every 2 mins #23013Please take a look at this tutorial on rendering chart on user input.
Kindly share a sample project showcasing your requirements along with sample database over Google-Drive or Onedrive so that we can understand your requirement better and help you out.
__
Priyanka M S
Team CanvasJSI hope one of our team members has already extended help in solving your issue over live chat. If you further face any issue, kindly share a jsfiddle reproducing the issue, so that we can look into your code, understand it better and help you out.
__
Priyanka M S
team CanvasJSCrosshair will be shown only when mouse move event is triggered on plot-area, as of now. We will reconsider this behavior for our future releases.
__
Priyanka M S
Team CanvasJSOctober 9, 2018 at 2:13 pm in reply to: Chart won't render to my div at the click of a button? #22965The code that you have shared seems to be working fine. Kindly cross-check the path of the script that you have specified in your app.
1. Save canvasjs.react.js and canvasjs.min.js within source-folder of your React application (src or src/assets or src/lib)
2. Import canvasjs.react.js to your app. (Please specify proper path of script if you have saved it in different folder like src or src/assets or src/lib)
import CanvasJSReact from './canvasjs.react';Please take a look at this sample project for an working example with proper path.
__
Priyanka M S
Team CanvasJSCan you please share a sample project along with sample database over google-drive or one-drive reproducing the issue you are facing, so that we can look into your code, understand the scenario better and help you out?
__
Priyanka M S
Team CanvasJS
