Login to Ask a Question or Reply
Forum Replies Created by Priyanka M S
-
Please refer the instructions provided to integrate CanvasJS with ASP.NET in our documentation.
If you still face an issue in rendering charts, kindly share a sample project with the issue your are facing over onedrive or google-drive so that we can understand your scenario better and help you out.
__
Priyanka M S
Team CanvasJSJohnSnowGum,
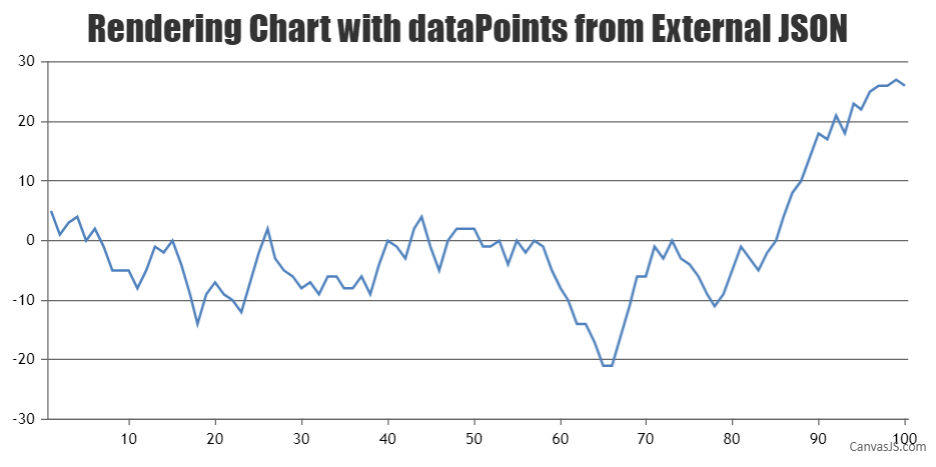
Please refer this documentation page for step-to-step tutorial on rendering chart with data from JSON source.

Please take a look into this JSFiddle for an example on chart with date here the data is served from an external JSON source.__
Priyanka M S
Team CanvasJSThanks for reporting this issue. It happens when you try to format tooltip content using {#percent%} for the dataPoints that has y value 0 and tooltip is shared. We will reconsider this issue and fix it in our future releases.
__
Priyanka M S
Team CanvasJSJohnSnowGum,
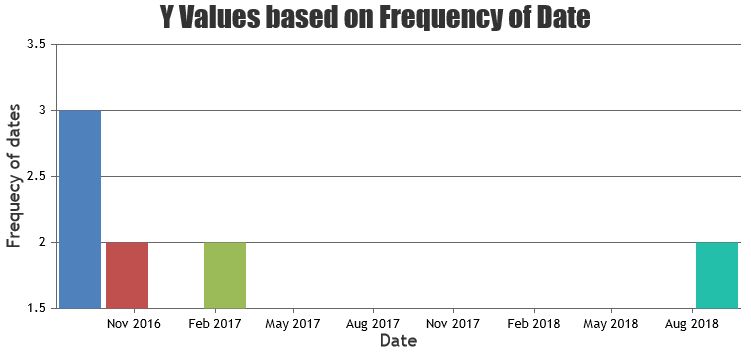
You can calculate the frequency the date-occurrences in the data & build a set of datapoints. Please refer the code-snippet below.
function calculateFrequency(dateArray) {
  dateArray.sort();
  var currentXValue = null;
  var count = 0;

  for (var i = 0; i < dateArray.length; i++) {
    if (dateArray[i] != currentXValue) {
      if (count > 0)
        dps.push({x: new Date(currentXValue), y: count});
      currentXValue = dateArray[i];
      count = 1;
    } else {
      count++;
    }
  }
  if (count > 0)
    dps.push({x: new Date(currentXValue), y: count});
}
Please take a look at this JSFiddle for complete code. This example reads data from an array instead of database.

__
Priyanka M S
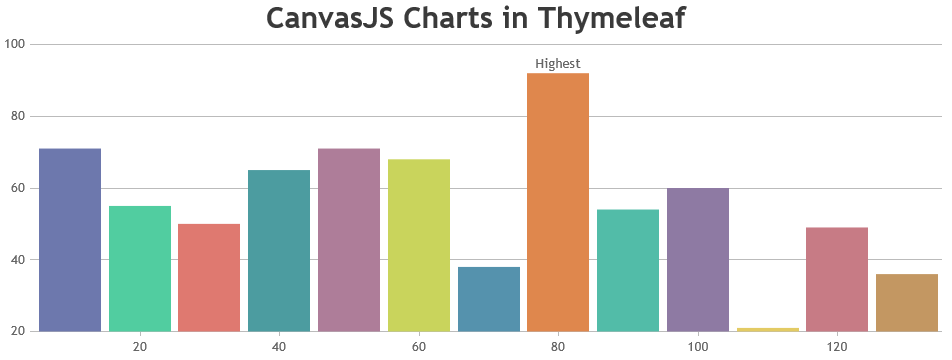
Team CanvasJSPlease take a look at this sample project for integrating CanvasJS in Spring MVC web-project that uses Thymeleaf template engine as view layer.

Also, check out this thread for more information.
__
Priyanka M S
Team CanvasJSPlease take a look at this jsfiddle. Here, the chart gets dynamically updated according to the external JSON source provided. Similarly, you can use a different data source that updates dynamically to plot a dynamic chart.
__
Priyanka M S
Team CanvasJSTrial Version is for evaluation purposes for up to 30 days. To use charts without ‘Trial Version’ and ‘CanvasJS’ Credit Link you will need to have a Commercial Version of CanvasJS. Please contact sales@canvasjs.com for sales related queries.
__
Priyanka M S
Team CanvasJSThanks for reporting this use-case. It seems to happen when you are trying to format tooltip content using
{#percent%}for the dataPoints that has y value 0 and tooltip is shared. We will fix this issue in our future releases.__
Priyanka M S
Team CanvasJSWe are looking into it and will get back to you at the earliest.
__
Priyanka M S
Team CanvasJSThanks for your interest in CanvasJS. Are you looking for column charts?
If not, please brief us further about the type of chart you would like to use. Also, kindly provide a pictorial representation depicting your requirement along with sample data, so that we can understand your requirement better and help you out.
__
Priyanka M S
Team CanvasJSPadding is considered at the time of rendering and it varies from element to element. Padding applied to the elements are dependent on each other, hence it is not possible to control padding for one element externally and expect the other elements to be aligned properly.
We will reconsider this behavior in our future releases.
__
Priyanka M S
Team CanvasJSZoom in and Zoom out is not working
Please take a look at this jsfiddle. Setting appropriate minimum and maximum values should work fine.
Line Marker:- I don’t want the whole line, I need a line like what we marked in image 1 (see image-1, marked as option 1)
This feature is not available as of now. However, you can place stripLines at the values you need, as shown in this jsfiddle.
Can I handle zoom in and zoom out by an event (see image-1, marked as option 2)
This feature is not available as of now. However, you can achieve this by changing viewportMinimum and viewportMaximum every time zoom in / zoom out is clicked.
__
Priyanka M S
TeamCanvasJSThanks for your interest in CanvasJS. Our sales team will get in touch with you soon. For any sales related queries, please contact sales@canvasjs.com
__
Priyanka M S
Team CanvasJS