Login to Ask a Question or Reply
Forum Replies Created by Priyanka M S
-
September 24, 2018 at 12:27 pm in reply to: I cannot retrieve data from json data to show in chart? #22721
Can you please share a sample project over google-drive or one-drive reproducing the issue you are facing, so that we can look into your code, understand it better and help you out?
__
Priyanka M S
Team CanvasJSYou can set itemMaxWidth property to a required value and itemWrap property to false for legend, to truncate the channel names, as shown in this updated jsfiddle.
__
Priyanka M S
Team CanvasJSConsidering this post to be a duplicate of this thread and hence closing it.
__
Priyanka M S
Team CanvasJS1. https://jsfiddle.net/2jhaL9qk
This is the basic implementation. I am just pushing the new data points (x: timestamp and y: a random number). I am not using any initial data points. Everything works fine except during the first few seconds, the x-axis labels do not make sense. (Please increase the result tab area in JSfiddle)You can use valueFormatString to define the format of values / labels displayed on axis X and this should work fine in this case. Please take a look at this updated jsfiddle for the same.
Glad that you solved the other issues with the help of our documentation.
__
Priyanka M S
Team CanvasJSSeptember 20, 2018 at 6:19 pm in reply to: Tooltip is not actually working for the last point of canvasjs chart #22689Can you kindly create a static HTML file or the sample project reproducing the issue you are facing and share it over Google-Drive or Onedrive so that we can look into your code, understand the scenario better and help you out?
__
Priyanka M S
Team CanvasJSCan you please share a sample project over google-drive or one-drive reproducing the issue you are facing, so that we can look into your code, understand it better and help you out?
__
Priyanka M S
Team CanvasJSYou can save CanvasJS file (canvasjs.min.js) in src folder of your project (‘src/assets/js’ or ‘src/lib’) and import the CanvasJS library to your app using
import CanvasJS from 'canvasjs.min'(path may vary based on file location like ‘./src/assets/js/canvasjs.min’ or ‘./src/lib/canvasjs.min’). Or you can add it in your html file using script-tag. Please take a look at this ionic documentation on Adding 3rd Party Libraries.Also please refer this tutorial on How to Install 3rd Party Libraries in Ionic 2 and step-by-step guide given in this github thread for more info.
__
Priyanka M S
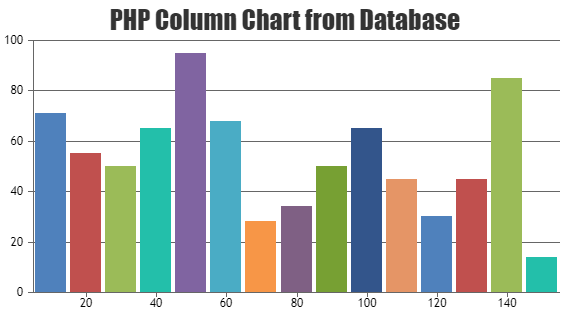
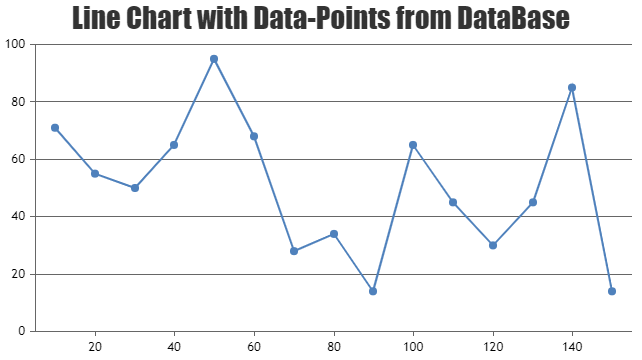
Team CanvasJSIf you are integrating CanvasJS with PHP, please take a look at this example on rendering chart data from database.

If integrating with ASP.NET, please take a look at these step-by-step instructions in our documentation on adding data to chart from the database.

__
Priyanka M S
Team CanvasJSIrrespective of when you receive the data for charts, defining line chart as the second dataSeries and updating dataPoints of the respective dataSeries on receiving data from web-socket or AJAX should work fine in your case. Please take a look at this JSFiddle where dataPoints for 1st dataSeries, which is of type column, is updated after clicking the button.
__
Priyanka M S
Team CanvasJSOnly when hovered on a dataPoint, a toolTip appears with the information about that dataPoint. It is not possible to show the toolTip permanently.
However, you can fix the position of toolTip at a required position as shown in this jsfiddle (hover on dataPoints to see the positioning of toolTip).__
Priyanka M S
Team CanvasJSMaking column chart(the bar chart which you have mentioned) as the first data series and line chart as the second data series should work fine in your case. Please take a look at this gallery example on combination charts.
__
Priyanka M S
Team CanvasJSWe are looking into it and will get back to you at the earliest.
__
Priyanka M S
CanvasJSCan you please share the link of the sample project reproducing the issue you are facing over one-drive or google-drive so that we can look into your code, understand the scenario better and help you out?
__
Priyanka M S
Team CanvasJS