Login to Ask a Question or Reply
Forum Replies Created by Manoj Mohan
-
You can place indexLabel either inside or outside the dataPoint by using indexLabelPlacement property.
—-
Manoj Mohan
Team CanvasJSEarlier WebKit allowed 448MB of canvas buffer memory whereas now they have dropped it to 224MB. Because of this, there was some memory issue with CanvasJS Charts in the latest iOS. However, we have optimized memory consumption in CanvasJS v2.3 – please check out this release blog for more info. Also, we will consider to improve it further in the future releases.
—–
Manoj Mohan
Team CanvasJSCan you kindly create a JSFiddle reproducing the issue and share it with us so that we can look into the code, understand the scenario better and help you out?
—–
Manoj Mohan
Team CanvasJSYou can set xValueFormatString to change the format of x-value displayed in toolTip and indexlabel. For more information about formatting options, please refer this documenation page.
—-
Manoj Mohan
Team CanvasJSGuilherme,
Can you kindly create JSFiddle with sample data and share it with us so that we can look into the code / chart-options being user, understand the scenario better and help you out?
In order to help us in understanding the issue better, please have a reproducible demo of your chart. This one step can assure you a speedy response. Fork out our template JSFiddle and reproduce the chart at your end. Try to keep it to the bare minimum by removing unnecessary code.
From what we have observed, sometimes things get delayed mostly when we are not able to reproduce the issue or not able to understand the exact requirements or the solution that we provide may not work properly due to the variation in chart-options being used by you and us.
Having a JSFiddle helps us in figuring out the issue and many a times we can just edit your code on JSFiddle to fix the issue right-away.
—-
Manoj Mohan
Team CanvasJSFor security reasons, cross-origin requests are restricted by browsers. JSONP allows you to sidestep the cross-origin requests. To access JSON from a different domain, you can refer to JSONP. Please take a look at this JSFiddle that creates a line chart from AJAX & JSONP.
—-
Manoj Mohan
Team CanvasJSSeptember 6, 2019 at 3:52 pm in reply to: X-Axis Minimum,Maximum and Interval Manual Plotting #26681Guilherme,
Chart elements may look blur on changing the zoom level within the display setting of browser or windows. Resetting zoom level to 100% should work fine in this case.
If the issue still persists, kindly share JSFiddle reproducing the issue so that we can look into your code, understand the scenario better and help you out.
—-
Manoj Mohan
Team CanvasJSRon,
1) timeframe (+/- seconds) for inclusion. like timeframe is 2seconds:
datapoint time = seconds h:i:05 include if seconds +/- 02 => seconds h:i:03-h:i:07. closest matching one -> not all. I gues this one is not easyToolTip shows all the values common to x value when shared property is set to true. But +/- 2 is not possible as of now.
2) Omit series from toolTip
3) Include only specified series in tooltip.You can omit a series / include a series in toolTip by setting toolTipContent to null in dataSeries if it has to be omitted. This can also be achieved using contentFormatter of toolTip as shown in this JSFiddle.
—-
Manoj Mohan
Team CanvasJSAs per the code snippet shared above, it looks like you are passing x-value as string in a dataPoint, whereas x-value can either be a numeric value or a dateTime value. Here is how you can make modify your index.html file:
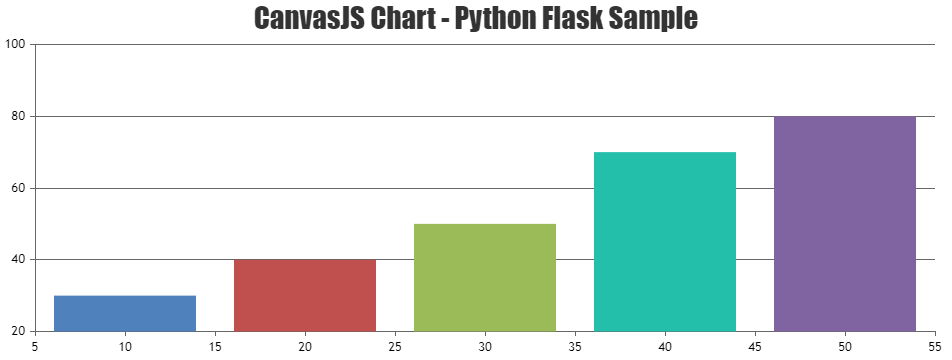
<html>
    <head>
        <meta name="viewport" content="width=device-width, initial-scale=1.0">
        <meta http-equiv="Content-Type" content="text/html; charset=utf-8" />
        <title>CanvasJS Chart Python Flask Sample</title>
        <script type="text/javascript" src="https://cdn.canvasjs.com/canvasjs.min.js"></script>
        <script type="text/javascript">
            window.onload = function() {
                var dps = [
                            {% for key,value in data.items() %}
                                { x: {{key}}, y: {{value}} },
                            {% endfor %}
                ];
                var chart = new CanvasJS.Chart("chartContainer", {
                    title:{
                        text: "CanvasJS Chart Python Flask Sample"
                    },
                    data: [
                    {
                        // Change type to "doughnut", "line", "splineArea", etc.
                        type: "column",
                        dataPoints: dps
                    }
                    ]
                });
                chart.render();
            }
        </script>
        <style type="text/css">
        </style>
    </head>
    <body>
        <div id="chartContainer" style="width: 100%; height: 300px;"></div>
    </body>
</html>
You can also take look at this sample project for a working example with sample code on the integration of CanvasJS with python flask.
If you are still facing the issue in integrating CanvasJS charts with python flask, kindly create a sample project reproducing the issue you are facing and share it with us(along with sample data) over Google-Drive or Onedrive so that we can run the sample locally at our end to understand the scenario better and help you out?
—-
Manoj Mohan
Team CanvasJSThanks for your suggestion. As of now, chart animates only on the first render – we will reconsider this behavior to animate on every re-render in future releases.
—
Manoj Mohan
Team CanvasJSThe innerHTML property allows reading and replacing everything within a given DOM element (HTML tag). In order to render a chart inside a div, you need to pass a unique id of div or DOM element of the div to CanvasJS.chart().
Using two div containers with a unique id and calling render method for the respective chart on the selected tab should work fine in your case. Please take a look at this JSFiddle. Also, refer this JSFiddle for an example on charts within Bootstrap tabs.
—-
Manoj Mohan
Team CanvasJSAugust 29, 2019 at 10:59 am in reply to: i am getting am error 'Cannot read property 'style' of undefined' in angular6 #26596From the error shown above, it seems there is no div with id
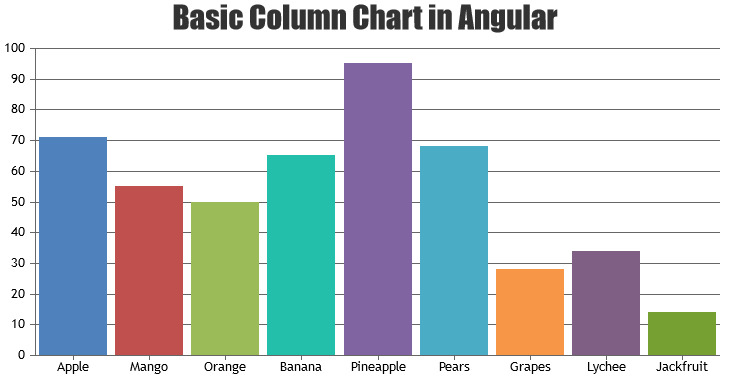
BarContaineron executing the code to render the chart. You can try to define div with idBarContainerin your html file.Also, you can check out our Angular Charts Gallery for examples on integrating chart in angular app.
If you are still facing the issue, kindly share Sample Project along with sample data reproducing the issue over Google Drive / Onedrive so that we can look into the code, understand the scenario better and help you out?
—-
Manoj Mohan
Team CanvasJSTo highlight the dataPoint in a line chart, you can set markerSize of dataPoint to higher value. Please take a look at this JSFiddle which highlights the dataPoint when the button is clicked.
If this doesn’t fulfill your requirement, kindly brief us more about requirement along with an example or pictorial representation so that we can understand your scenario better and help you out?
—-
Manoj Mohan
Team CanvasJS